According to the International Energy Agency’s Global Critical Minerals Outlook 2026, global critical mineral exploration spending fell by more than 10% in 2025. Exploration spending on lithium and nickel declined by around 45%, while spending on copper remained broadly stable.
This increasingly cautious investment environment stands in contrast to the persistent long-term pressure on critical mineral supply. The report notes that prices for base metals such as copper, aluminium and tin rose by roughly one-third between January 2025 and April 2026, with copper reaching a record high. Based on the IEA’s base-case project pipeline, expected mine supply in 2035 could be approximately 25% below primary copper supply requirements under the Stated Policies Scenario.
On one side are tighter, more concentrated exploration budgets; on the other is a long-term resource gap that remains unresolved. For teams advancing exploration projects, the question is no longer simply how to identify more anomalies. It is how to determine, earlier and within a limited budget, which areas should be prioritised for field reconnaissance, sampling, geophysical surveys and drilling.
Investors have not abandoned the sector, but they have become more selective. The IEA also reports that mining venture capital investment recovered in 2025, increasingly targeting artificial intelligence technologies capable of improving the efficiency of mineral exploration and resource extraction.
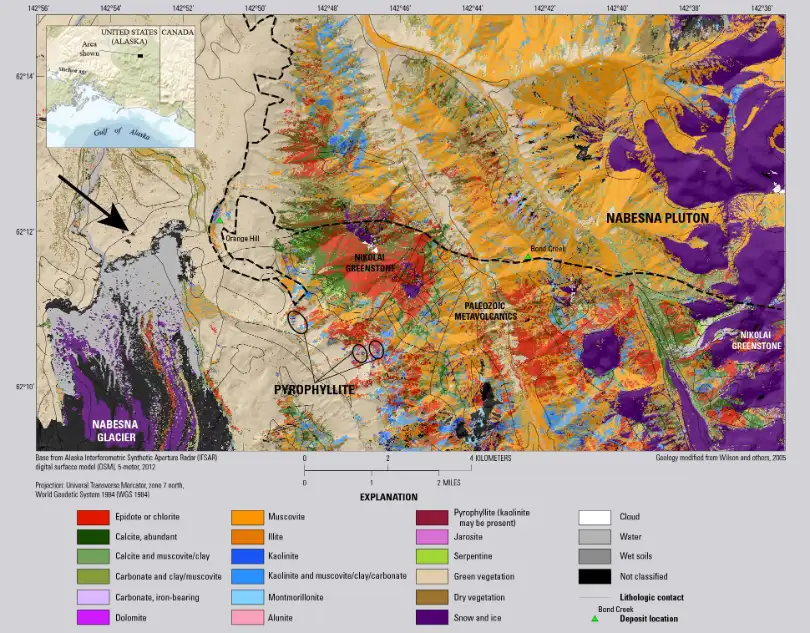
Hyperspectral remote sensing addresses precisely this need. It cannot confirm a subsurface orebody from space, but it can use the “spectral fingerprints” of surface minerals to identify alteration information, adding a layer of mineralogical evidence to large-area screening and fieldwork prioritisation. For exploration teams, the value lies not simply in acquiring more imagery, but in establishing a broader and more consistent basis for comparing candidate areas before deploying geologists to the field. Explore how satellite data can support mining decisions →
From Observing the Surface to Identifying Mineral “Spectral Fingerprints”
Multispectral satellite imagery has long been an important tool for geological mapping and mineral exploration. It helps researchers observe landforms, lithological differences, structural features and certain alteration anomalies. However, because multispectral imagery contains a relatively limited number of broad bands, it often provides only broad discrimination between minerals with similar spectral characteristics and may not resolve their finer differences.
In project areas with limited geological survey coverage and insufficient baseline data, this limitation can make regional interpretation and field verification more difficult. The challenge is particularly significant in remote mineral concessions, where access, personnel deployment and logistics are costly. For early-stage exploration, obtaining more detailed mineral information before launching extensive ground campaigns can therefore be highly valuable.
Hyperspectral remote sensing provides a different way of observing the surface. Whereas multispectral imagery records reflected energy in a small number of broad bands, hyperspectral sensors pide the spectrum into numerous contiguous, narrow bands, recording a much more detailed reflectance spectrum for every pixel.This makes it easier to distinguish surface materials that may appear similar in conventional optical imagery.
Minerals differ in their internal structures and chemical compositions, causing them to absorb and reflect light differently across wavelengths. The underlying physical mechanisms include electronic transitions and molecular vibrations. On a spectral curve, these differences appear as reflectance peaks, absorption troughs and distinctive curve shapes. Such diagnostically significant absorption features act like the “spectral fingerprints” left by inpidual minerals.

Example spectra in the 1.6- to 2.5-micrometer wavelength region showing diagnostic absorption features (dips) for calcite, antigorite, muscovite, and gypsum.
Researchers can compare spectra extracted from satellite imagery with reference mineral spectra, much like matching the characteristics of a fingerprint, to determine which minerals may be exposed at the surface and subsequently map their spatial distribution.
Hyperspectral imagery therefore provides more than a clearer picture of the Earth’s surface. While conventional optical imagery primarily reveals differences in colour, texture and form, hyperspectral data can capture spectral features associated with material structure and composition—moving remote sensing from “observing appearance” towards “distinguishing composition.”
By integrating imaging and spectroscopy, hyperspectral remote sensing can create a spatially continuous map of remotely sensed surface-mineral information, providing an additional source of evidence for regional mineral identification, alteration mapping, area comparison and subsequent field verification.
From a Single Satellite Pass to Regional-Scale Mineral Mapping
The AHSI sensor aboard GF-5, for example, records 330 spectral channels across the visible, near-infrared and shortwave-infrared range. With a swath width of approximately 60 km and a spatial resolution of 30 m, it can capture broad regional coverage while preserving the spectral detail needed to compare surface mineral and alteration patterns.
A published study in the Huaniushan area of Guazhou County, Gansu Province, demonstrates how this form of regional mineral scanning can support geological investigation. Using GF-5 hyperspectral data, the research team extracted and mapped nine types of alteration mineral information across approximately 3,600 km². These included limonite, hematite, chlorite, calcite, dolomite and four mica groups differentiated by the positions of their diagnostic absorption peaks.The mineral-mapping results were subsequently evaluated through field geological investigation and ASD field-spectrometer measurements.

Map showing distribution of alteration minerals extracted from hyperspectral data in the Huaniushan area
1-Limonite;2-Hematite;3-Chlorite;4-Calcite;5-Dolomite;6-Short-wave sericite;7-Medium-toshort-wave sericitemica;8-Medium-tolong-wave sericite;9-Long-wave sericite;10-Field verification point;11-Place name
For exploration, the value lies not only in identifying which minerals are present, but also in understanding how they occur together, the directions in which they extend and whether their distribution corresponds with stratigraphic units, intrusive contacts and fault structures.
As ore-forming hydrothermal fluids migrate through fractures or along intrusive contacts, they may react with the surrounding rocks and create alteration mineral assemblages with recognisable spatial patterns. Some of these hydrothermal alteration minerals may be exposed at the surface, allowing their spectral characteristics to serve as mappable indicators of the broader mineralising environment.
In the Huaniushan study, the directional distribution of dolomite and calcite was used to help interpret surface exposures of carbonate-bearing sedimentary–metamorphic strata. Chlorite potentially indicated the distribution of amphibole-rich geological bodies, while micas with different absorption peak positions provided additional information for analysing intrusive bodies, contact zones, fault structures and associated hydrothermal activity.
The result was therefore more than a list of identified minerals. It was a spatially continuous map of remotely sensed surface-mineral information covering approximately 3,600 km², which could be interpreted alongside the regional geological framework. Point-based reconnaissance and sampling provide localised observations; hyperspectral mineral mapping can first establish a continuous distribution of geological clues, helping teams compare candidate areas and plan subsequent fieldwork and sampling more strategically. Learn more about hyperspectral mineral identification and target prioritisation workflows →
From Huaniushan to Western Chagai: How Hyperspectral Mineral Information Supports Exploration Decisions
The Huaniushan study demonstrates the application of hyperspectral mineral mapping to regional geological investigation. Peer-reviewed research from a very different geological setting provides further evidence of how the method can support exploration.
A 2024 study published in Economic Geology applied spaceborne hyperspectral data from the ZY1-02D satellite to Pakistan’s Western Chagai Belt. Extending approximately 400 km from east to west, the belt hosts the world-class Reko Diq porphyry copper-gold deposit and the Saindak deposit.
Using hyperspectral data comprising 166 bands across the 0.4–2.5 μm range, the researchers mapped mineral information across approximately 8,000 km². They identified alteration minerals including muscovite/sericite, kaolinite, alunite, epidote, chlorite and calcite, and proposed 23 new potential targets for further exploration of porphyry copper mineralisation.
In this context, a “target” refers to a candidate area that displays more favourable indicators than its surroundings and therefore merits priority in the next stage of investigation.
The researchers subsequently conducted field verification at three targets and six additional alteration sites. According to the paper, evidence of copper-gold mineralisation was found at all inspected locations. This result demonstrates the role hyperspectral mineral mapping can play in connecting regional screening with field investigation: it helps geologists identify locations that warrant earlier verification, shifting fieldwork from broad-area searching towards focused investigation supported by identifiable evidence.
The paper also notes that ZY1-02D data can cover most of the world’s land areas, providing a potential new data source for mineral exploration and lithological mapping in remote regions with limited access and insufficient baseline geological information.
Despite their different geological settings, the Huaniushan and Western Chagai studies demonstrate a similar workflow: use satellite data to establish a broad, continuous mineral information map; interpret that information within the regional geological context; identify areas that merit priority investigation; and finally verify the remote sensing evidence in the field.
The central value of hyperspectral remote sensing is its ability to progressively narrow an otherwise extensive search area and provide a more informed direction for subsequent reconnaissance, sampling and geophysical surveys.
In practice, satellite-derived mineral information should be interpreted alongside lithology, faults, intrusive contacts, historical mineral occurrences, geochemical data and geophysical evidence. Vegetation, soil, weathering, mineral abundance and mixed pixels must also be considered. Candidate areas supported by multiple, mutually reinforcing lines of evidence can then be prioritised for field verification, followed by sampling, geophysical surveys, drilling and laboratory analysis to progressively assess mineralisation characteristics, grade, three-dimensional geometry and resource potential.

Ground-based hyperspectral imaging of hydrothermally altered rock at Cuprite, Nevada. Field spectroscopy can support the interpretation and verification of remotely sensed mineral information. Credit: Todd Hoefen, U.S. Geological Survey.
For mining companies—particularly those managing extensive exploration areas—this means transforming an overly broad search problem into a set of candidate areas that can be compared, ranked and tested, allowing limited field resources to be directed towards locations supported by stronger evidence.
STARPATH GLOBAL: From Technical Feasibility to Value Validation
For an early-stage exploration project, the first step is not necessarily to purchase data immediately. It is to determine whether hyperspectral remote sensing can effectively support the decision at hand: whether the target area has suitable surface and data conditions, how existing geological information can be incorporated into the analysis, and whether the resulting outputs will support fieldwork planning, target prioritisation or a more specific investment decision.
Every exploration area has its own geological setting, surface conditions and data availability. This is why STARPATH GLOBAL brings its FDE—Forward Deployed Engineers—service model into the mining remote sensing workflow. Drawing on the target commodity, mineral concession area, surface conditions, available data and next-stage exploration plan, our engineers work with clients to turn the broad question of whether satellites can support mineral exploration into a practical and testable data and analysis pathway.Just as hyperspectral mapping progressively narrows a broad geographical area into candidate targets, FDE helps translate a technical concept into an application whose business value can be tested.
For qualifying Pioneer Partners, STARPATH GLOBAL covers the associated costs of early-stage opportunity scoping, solution design, engineering collaboration and value validation. Once the potential business value and expected returns have been validated, the parties can decide whether to proceed with a formal commercial engagement and scale the solution.
If you are planning a new round of regional screening or field investigation, you can submit your target commodity, area of interest (AOI), available data and the exploration decision you most want to improve. Apply to join the Pioneer Partner Program →