Urban flood monitoring has long faced a visibility gap. Fixed water-level sensors cannot cover every road, resident reports depend on reporting behavior, and flood models cannot fully capture actual street conditions during a particular storm. A study published in Nature Communications in 2026 introduces BayFlood, which first uses a vision-language model to identify flooding in dashcam images without task-specific training. A spatial Bayesian model then combines these predictions with a small set of manually verified images and urban geographic data to estimate the proportion of images showing flooding within each census tract.
The researchers validated the approach using 1,440,184 street-level images collected across multiple rainfall events in New York City and the San Francisco Bay Area. In the main experiment, covering New York City’s September 29, 2023 rainstorm, 65.8% of images classified as flooded were confirmed by human reviewers. Among sampled images classified as non-flooded, 0.6% actually showed flooding.
The authors also identified census tracts with high BayFlood risk where none of three conventional sources—311 complaints, predicted flood maps or water-level sensors—provided a risk indication. These tracts were home to 100,150 people. This figure represents the population of the relevant areas, not the number of individually confirmed flood victims. All figures above come from the Version of Record. [1]
1. The Monitoring Challenge: Why Street Flooding Can Go Unrecorded
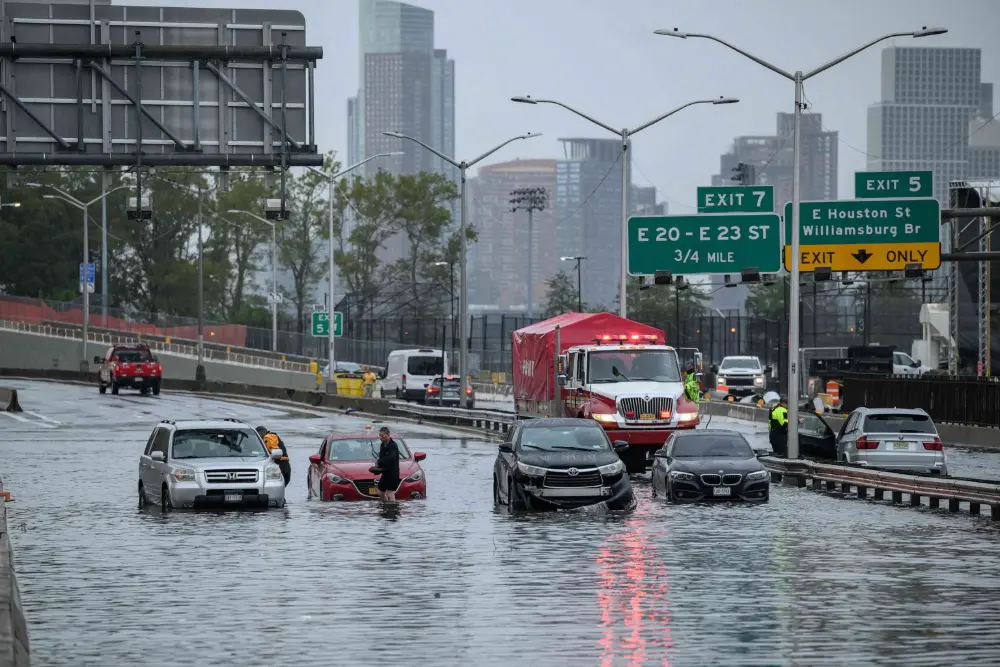
Urban flooding is highly localized. During the same rainstorm, neighboring streets can experience very different conditions because of variations in elevation, drainage inlets or rainfall. Existing monitoring systems have data, but each source has blind spots.
Fixed sensors continuously measure conditions at specific locations, but deploying them on every street is impractical. New York City has roughly 40,000 intersections, while the FloodNet network described in the paper had only around 250 sensors deployed at the time. Residents can report flooding through the 311 system, providing information closely tied to everyday conditions. Yet an absence of complaints does not mean an absence of flooding. Physics-based stormwater models can map potential accumulation zones in advance, but actual rainfall patterns, simplified drainage networks and blocked drainage infrastructure can all affect how closely predictions match conditions on the ground. [1]
This creates an opportunity for mobile observation. As vehicles travel through a city, dashcams continuously capture actual street scenes. Flooding, however, is a rare event: even on a day of heavy rain, most images show no obvious standing water. Traditional supervised learning would therefore require costly labeling to obtain enough positive examples.
2. The Dataset: Turning Road Images into Geographic Evidence
The authors used dashcam data supplied by Nexar for research. The core dataset covered New York City’s September 29, 2023 rainstorm. After excluding approximately 13,000 nighttime images, the main experiment used 926,212 images.
The unit of analysis was the census tract, rather than an individual image or the city as a whole. New York City has 2,327 census tracts. In the main dataset, the median tract contained 220 images, and 94.5% of tracts had at least 50 images.
Three additional validation datasets included 158,555 images from New York City on December 17–18, 2023; 331,034 from New York City on January 9–10, 2024; and 24,383 from the San Francisco Bay Area on February 10, 2024. Together, the four datasets contained exactly 1,440,184 images.
The authors also used 311 complaints, FloodNet sensors, predicted stormwater accumulation zones, catch basin information, digital elevation data and demographic data from the American Community Survey. These sources supplied environmental variables for the model and supported independent validation. [1]

Spatial distribution of images in our primary analysis dataset.
Figure 2 shows the distribution of image counts across census tracts, alongside examples of street scenes classified as flooded and non-flooded. It illustrates coverage at the census-tract level rather than demonstrating that vehicles observed every road. Data become substantially sparser at the finer census block-group or block level. [1]
3. How BayFlood Works: Visual Detection Followed by Statistical Calibration
The first stage is zero-shot visual recognition. The authors used the 13-billion-parameter Cambrian-1 vision-language model and asked a specific question: “Does the street in this image show more than a foot of standing water?” The prompt focuses the model on more substantial street flooding and aligns with the deep-flooding definition used by the relevant New York City agency.
The model classified all 926,212 images in the main dataset, labeling 0.2% as positive. This 0.2% is the proportion of images classified as flooded, not the city’s actual flooding rate. [1]
The researchers then randomly sampled 500 model-positive and 500 model-negative images for human visual review. This allowed them to estimate the model’s classification errors without manually labeling nearly one million photographs.
The second stage is spatial Bayesian inference. A few model-positive images in a tract cannot directly establish its true proportion of flooded images. Classification errors, limited samples and spatial relationships between neighboring tracts all introduce uncertainty that needs to be addressed explicitly.
BayFlood combines model predictions, a small set of human-verified labels and optional external variables. An intrinsic conditional autoregressive (ICAR) spatial term smooths estimates across neighboring tracts. The paper’s core formulation can be expressed in plain text as:
r_c = P(y = 1 | C = c)
r_c = logit^-1(alpha + X_c * beta + phi_c * sigma_phi)
Here, r_c is the model-estimated probability that a randomly selected image from tract c truly shows flooding. X_c represents tract characteristics, beta represents their corresponding coefficients, and phi_c and sigma_phi describe the spatial component.
r_c is neither a measured water depth nor the proportion of a census tract’s land area that is inundated. When testing agreement with external flood indicators, the authors deliberately excluded those validation variables from the Bayesian model, avoiding the use of the same data for both prediction and validation. [1]

Overview of the flood detection pipeline
Figure 1 presents four layers of information flowing upward: dashcam imagery, visual-model classifications, external data and manually verified labels, and the final estimated proportion of flooded images in each census tract. It illustrates the study’s central logic: statistically calibrating large-scale visual predictions, rather than producing a flood map whenever a photograph contains water. [1]
4. The Evidence: How Reliable Are the Results?
The main experiment achieved a positive predictive value (PPV) of 0.658. In other words, a randomly selected image classified as flooded had a 65.8% probability of being confirmed by human reviewers as showing clear flooding.
The false omission rate (FOR) was 0.006: among sampled images classified as non-flooded, 0.6% actually showed flooding. These figures indicate a strong detection signal, but they do not imply an overall accuracy of 99.4%, and neither figure can be directly interpreted as recall. [1]
Across the three additional datasets covering other storm dates and locations, model-positive images were at least 351, 406 and 72 times as likely, respectively, to show actual flooding as model-negative images.
In independent validation that excluded external indicators from model fitting, high-BayFlood-risk tracts were 1.3 times as likely as other tracts to have a 311 flood complaint and 1.9 times as likely to contain a FloodNet sensor. These associations support the plausibility of the results, but they do not replace measured water-depth validation at individual road segments. [1]
5. The Key Finding: Gaps Shared by Maps, Sensors and Complaint Systems
The study defined a tract as having “high BayFlood risk” if it contained a manually confirmed flooded image, or if its estimated r_c exceeded the 25th percentile of the r_c distribution among tracts with confirmed flooding.
Under this research definition, 1,046,493 New York City residents—approximately 12% of the city’s population—lived in high-risk tracts. Of these:
- 832,929 lived in tracts without a FloodNet sensor.
- 254,159 lived in tracts without a predicted stormwater accumulation zone.
- 390,121 lived in tracts without a 311 flood complaint.
- 100,150 lived in tracts where all three conventional methods lacked a risk indication.
These groups overlap and should not be added together. [1]

Improving flood detection and response in New YorkCity.
Figure 3, panels A–D, shows monitoring gaps identified by BayFlood compared with 311 complaints, predicted flood zones and FloodNet sensors. Panel E shows statistical associations between 311 complaints and demographic characteristics after controlling for the estimated proportion of flooded images. Panel F shows existing sensors and proposed additional locations. The proposed locations are research recommendations, not sensors that have already been installed. [1]
The study also makes it possible to examine whose experiences are more likely to be recorded. The authors used the presence or absence of a 311 complaint as the response variable in a logistic regression, including both BayFlood’s r_c and demographic characteristics as predictors. This tests whether communities differ in their propensity to report flooding under comparable estimated flood conditions.
The aim is to distinguish actual flood risk from the probability that it enters the official record, rather than judging residents’ willingness to act from complaint counts alone. [1]
6. Scientific Contribution and Limitations: Adding Street-Level Evidence to Remote Sensing
From a remote sensing, mapping and urban digital twin perspective, the study’s most significant contribution is the combination of mobile ground imagery, limited human verification, spatial statistical inference and multiple urban datasets. The approach turns scattered, noisy street images into flood-exposure indicators that can be compared across geographic units, with uncertainty explicitly represented.
For street flooding that satellites cannot continuously observe directly, this offers a complementary source of evidence. Joint estimation with satellite imagery remains a potential application, rather than an experimental result demonstrated in this paper.
The limitations are equally clear. Dashcams observe roads rather than the entire urban surface, and vehicle traffic affects spatial sampling. The authors excluded nighttime images from the main experiment because flooding was difficult to identify after dark, so the results do not establish performance at all hours.
The method directly estimates the proportion of images showing clear flooding. It does not estimate continuous water depth, peak discharge or actual inundated area. The paper also notes that the original Nexar imagery cannot be shared publicly, limiting full reproduction at the image level. The authors instead provide aggregated data for statistical analysis and accompanying code. [1][2]
7. Conclusion
BayFlood addresses a practical question: when flooding produces no sensor reading, no resident complaint and no warning from an existing prediction map, can cameras already moving through city streets help reveal it?
Using more than 1.4 million real dashcam images, the study shows that they can provide valuable supplementary evidence. BayFlood is a statistically calibrated addition to flood observation. It has not been validated as a complete monitoring system capable of replacing water-level sensors, specialist stormwater models or remote sensing imagery.
For cities seeking a clearer picture of flooding, the practical challenge is bringing complementary observations into a workflow that supports action. STARPATH GLOBAL combines in-house software development with multi-source satellite data to support monitoring, alerts and decision support. City agencies and infrastructure operators can explore monitoring options with the team, matching data resolution and update frequency to local needs and connecting satellite observations with available ground information.
References
[1] Franchi, M., Garg, N., Ju, W., & Pierson, E. (2026). Improving flood detection with large-scale dashboard camera data. Nature Communications, 17, Article 9208. https://doi.org/10.1038/s41467-026-75938-1. All experimental figures, equations and references to Figures 1–3 in this article were checked against the Version of Record.
[2] The authors’ public BayFlood code and data documentation: https://github.com/pendulating/bayflood. Provided as a reproducibility resource, rather than a substitute for the published paper’s results.
Original paper: Improving flood detection with large-scale dashboard camera data
Authors: Matt Franchi, Nikhil Garg, Wendy Ju and Emma Pierson
Journal: Nature Communications, Volume 17, Article 9208
DOI: 10.1038/s41467-026-75938-1
Publication details: Published online on July 29, 2026; August 28, 2026 is the date listed by the publisher for the Version of Record.
Full paper: https://doi.org/10.1038/s41467-026-75938-1