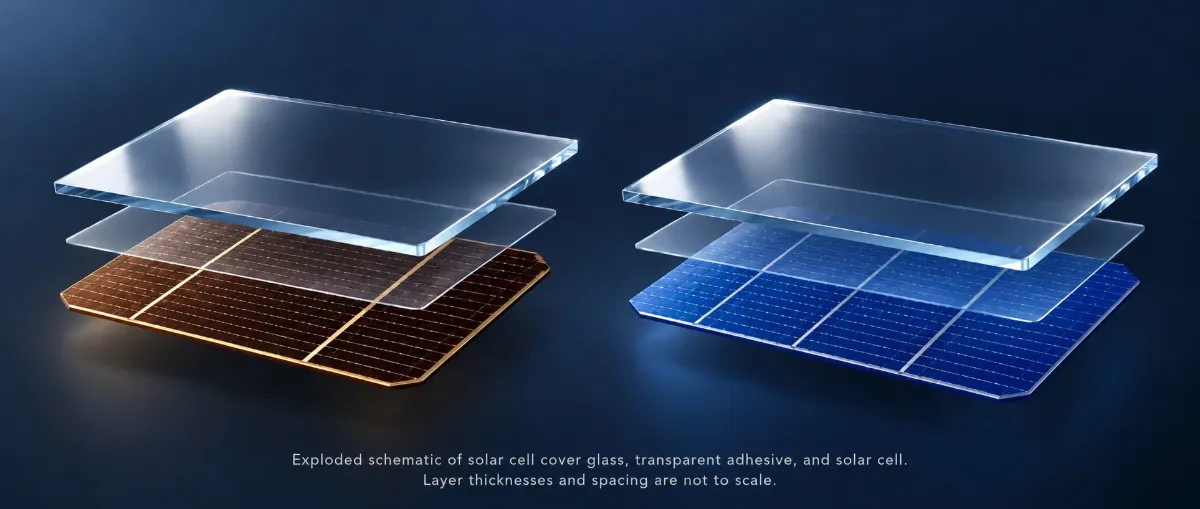
Viewed from space, the first layer sunlight encounters on a solar array is the cover glass, followed by a transparent adhesive layer and the solar cell itself. Typically measured in tenths of a millimeter, the glass performs two jobs at once: it faces the space environment while allowing useful light to reach the cell. How much shortwave ultraviolet radiation it blocks—and how much electricity-generating light it transmits—ultimately affects the performance of the bonded solar cell assembly.
Cerium doping is a common approach to cover glass design. Cerium produces specific ultraviolet absorption in the glass and helps reduce radiation-induced darkening. Selecting cover glass also requires considering its thickness, coatings, adhesive layer, and the cell’s spectral response together to determine how much electricity the solar array can generate. The following sections trace this optical path, explain how to read a product datasheet, and examine how performance is measured.[1][2][3]
1. Cover Glass, Adhesive, and Cell: The Three Layers Along the Optical Path
When sunlight reaches the cover glass, some is reflected and some enters the material. Light entering the glass may then be absorbed at particular wavelengths. The transmitted light continues through the adhesive before reaching the semiconductor cell. The cell absorbs photons it can use, generating charge carriers that can be collected as electric current. A cover glass transmittance value therefore needs to specify both the measurement wavelength and where the optical path ends: at the back of the glass, or after light has entered the adhesive. These boundaries give the measurement different meanings.[2][3]
The adhesive’s position makes protection against shortwave ultraviolet radiation particularly important. It must maintain both adhesion and transparency over a long service life. Intense illumination and other effects of the space environment can cause aging and discoloration. A darkened adhesive layer reduces the light reaching the cell, lowering assembly current and power. The European Space Agency tested candidate adhesives sandwiched between two glass sheets under simulated space conditions for more than 10,000 hours, assessing changes in color and light transmission. That experiment examined the adhesive’s long-term performance.[10]
Initial filtering and long-term aging operate on different timescales. Cover glass changes the incident spectrum from the first day it is installed. If the adhesive gradually loses transparency over years of exposure, additional losses accumulate. A given cover glass–adhesive–cell combination therefore needs both initial electrical performance measurements after assembly and measurements of retained performance after specified environmental testing. Connecting material measurements with assembly measurements reveals how the optical path changes.[1][3]
Cover glass also provides some shielding against charged particles. Electron and proton penetration depends on particle energy and glass thickness, while ultraviolet transmission depends on the wavelength-dependent properties of the glass and its surface coatings. These effects must be measured and calculated separately. Because lightweight solar arrays cannot accommodate indefinitely thicker glass, optical transmission, particle protection, and mass per unit area must be balanced together.[1][3]
2. Why Cerium? Attenuating Shortwave Light Before It Reaches the Adhesive
Sunlight spans ultraviolet, visible, and near-infrared wavelengths. UV-B covers 280–315 nanometers, while UV-A covers 315–400 nanometers. Here, nanometers describe the wavelength of light: the shorter the wavelength, the greater the energy of an individual photon.[9]
A useful approximation is E ≈ 1240/λ, where E is photon energy in electron volts and λ is wavelength in nanometers. A 300-nanometer photon carries approximately 4.13 electron volts, compared with about 3.10 electron volts at 400 nanometers. Shortwave light can trigger photochemical changes in certain materials, making the adhesive along the optical path a particular concern.[10]
Two common engineering approaches address this problem. Fused silica cover glass can transmit substantial ultraviolet radiation, so a UV-reflective surface coating redirects the shortwave light that needs to be attenuated. Cerium-doped borosilicate glass instead uses absorption within the material to remove shortwave ultraviolet radiation before it reaches the adhesive. Both approaches are described in NASA/JPL’s review of earlier cover glass technology and the 2023 ECSS standard for photovoltaic assemblies. They address the same protection requirement along the optical path, but act at different locations.[1][3]
Glass transmittance changes progressively with wavelength. Designers need to determine which harmful wavelengths are attenuated and which useful wavelengths are lost. Visible and near-infrared light generally account for most of a cell’s photogenerated current, so the cover glass must maintain high transmission in those bands. The position of the shortwave filtering edge varies with glass composition, thickness, and processing.[2][4][5]
Cerium has a second, long-term role: helping the cover glass remain transparent after irradiation. High-energy particles or intense ultraviolet radiation can create new light-absorbing defects within glass, gradually darkening an initially transparent material. This phenomenon is commonly called radiation-induced darkening or solarization. Cerium-related constituents help suppress these changes. SCHOTT identifies both ultraviolet absorption and optical stability after irradiation as functions of its cover glass.[1][6][7]
The first function—filtering shortwave light from the outset—is assessed using the initial transmission spectrum. The second—limiting darkening after irradiation—is assessed by measuring how much transmission remains in electricity-generating bands after a specified exposure. These require separate datasets.[1][2]
3. What Happens to Light and Electrons When Cerium Enters Glass?
During glass melting, cerium-containing raw materials enter the melt with the other ingredients. After cooling, cerium can exist in different oxidation states: Ce³⁺ is trivalent cerium and Ce⁴⁺ is tetravalent cerium. An oxidation state describes the charge state associated with electron loss. It affects electronic energy levels and therefore the photons the material can absorb. Glass composition, redox conditions during melting, and subsequent processing influence these states, helping explain why different cerium-doped glasses can have different transmission curves.[4][5]
One absorption mechanism involves an electron in Ce³⁺ absorbing a photon and moving from a lower 4f energy level to a 5d level. This transition occurs when the electron receives the appropriate energy to enter another allowed state, supplied by the absorbed photon. Charge transfer associated with Ce⁴⁺ also contributes to ultraviolet absorption: an electron moves between states associated with different ions, consuming a photon of the corresponding energy. Researchers have measured these absorption bands in several glass systems, but their positions and strengths depend on the glass matrix. For a commercial cover glass, engineering assessment ultimately relies on the finished product’s transmission spectrum.[4][5]
Another important concept is the color center. After irradiation, electrons or “holes”—positive charge sites left when electrons move away—can become trapped in local structures, creating new light-absorbing centers. These defects absorb additional light passing through the glass, producing visible darkening. NASA/JPL reports describe cerium’s ability to help suppress color center formation. Earlier NASA experiments also exposed cerium-doped cover glass samples to electrons and protons to investigate transmission retention after irradiation.[1][7]
A 1962 experiment on potassium barium silicate glass first used gamma rays to bring different samples to the same degree of coloration, then compared how quickly the color faded. Samples containing more Ce³⁺ faded faster. The researchers proposed that cerium promoted electron–hole recombination: oppositely charged products of excitation recombined, gradually reducing the absorbing defects. This identified one mechanism of post-irradiation recovery. For spacecraft cover glass, retained transmission must still be established by comparing the target glass’s spectra before and after specified irradiation.[12][3]
Commercial documentation also presents information at two different levels. SCHOTT’s Solar Glass 0787 Material Data Sheet lists a CeO₂ mass fraction below 2% in its raw-material oxide composition. This is the publicly disclosed compositional range. The product datasheet’s transmittance values describe the optical behavior of the finished glass. Composition data help identify the material system; comparing finished cover glasses requires considering thickness, transmission spectra, and changes after irradiation together.[2][11]
4. How to Read the Numbers for 0.100-Millimeter Cover Glass
Start with the basic definition: transmittance at a particular wavelength is the ratio of optical power transmitted through a specimen to incident optical power at that wavelength. A measured value of 91.3% at 400 nanometers means that, under the datasheet’s specified optical arrangement, approximately 91.3 out of every 100 units of incident light pass through the measurement boundary. The remaining light is accounted for by surface reflection and glass absorption. At another wavelength, both absorption and reflection can change, producing a different transmittance.[2]
For SCHOTT Solar Glass 0787, the datasheet row for uncoated glass at a thickness of 0.100 millimeters gives two types of reading: an arithmetic mean transmittance of 11.4% over 300–315 nanometers and a single-wavelength value of 91.3% at 400 nanometers. The first summarizes multiple measurement points across an interval; the second describes just one wavelength.[2]
The 300–315-nanometer interval lies at the long-wavelength end of UV-B. The 400-nanometer point lies at the long-wavelength boundary of UV-A, close to the beginning of visible light. These positions show how differently the material behaves in shortwave ultraviolet radiation and near the visible-light boundary.[2][9]
An arithmetic mean adds the transmittance readings used for that interval and divides by the number of readings. It describes average glass transmission across that wavelength range. It does not describe how many photons sunlight actually supplies within the range. To estimate current, each wavelength must also be weighted by the solar photon flux and the cell’s response. The same average transmittance can therefore produce different current changes under different spectra. This is why the electrical calculation must be performed wavelength by wavelength.[2][8]
The datasheet also lists a cutoff wavelength of 332 nanometers under “Optical Properties.” Its definition is specific: for a thickness of 0.100 millimeters, the cutoff is the wavelength at which transmittance reaches 46%. Under the corresponding measurement conditions, approximately 46 out of every 100 units of incident light at 332 nanometers pass through.[2]
Because UV-A extends from 315 to 400 nanometers, 332 nanometers lies toward its short-wavelength end. Moving toward longer wavelengths, transmittance rises progressively through a transition region. “Cutoff” refers to a particular measurement point selected by the manufacturer.[2][9]
Reading the datasheet also requires checking where the optical path ends. For 0787, separate entries describe uncoated glass, glass with an antireflection coating on one side, and transmission into the adhesive for glass with that coating. At 400 nanometers, the respective values are 91.3%, 92.3%, and 95.8%.[2]
Why does the value increase to 95.8% when light enters the adhesive? Reflection at an interface depends on the refractive indices of the materials on either side. Refractive index is the ratio of the speed of light in vacuum to its speed in a material. The refractive indices of glass and adhesive are more closely matched than those of glass and air, reducing rear-surface reflection and allowing more light to enter the adhesive.[2][3]
The ECSS method for measuring “transmittance into adhesive” uses an index-matching liquid with a refractive index of 1.41 and a backing plate to simulate this optical contact, with a correction for reflection from the backing plate’s outer surface. The 95.8% value in the 0787 datasheet ends at the point where light enters the adhesive. Absorption within the actual adhesive and reflection at the adhesive–cell interface still affect how much light reaches the cell.[2][3]
The antireflection coating discussed here helps deliver more useful light into the material. The UV-reflective coating used with fused silica specifically reflects shortwave light away. These coatings serve different purposes and wavelength ranges. When comparing candidate cover glasses, first match thickness, coating condition, and measurement interface to the intended assembly, then examine transmission across the cell’s response bands along the same optical path.[2][3]
Thickness affects both absorption and mass. A longer path through the glass generally produces greater attenuation in bands where the material absorbs light. Mass per unit area equals density multiplied by thickness. Using the 0787 density of 2.51 grams per cubic centimeter, the glass alone at 0.100 millimeters weighs approximately 0.251 kilograms per square meter. Increasing thickness therefore requires balancing optical losses, mass, and particle protection.[2][3]
The datasheet also plots continuous spectra before and after irradiation for a 0.150-millimeter specimen. Its ultraviolet solarization conditions specify a vacuum of approximately 10⁻³ pascals and an integrated exposure equivalent to 2,000 sun hours. These curves illustrate how engineers can compare changes before and after exposure. The three readings for 0.100-millimeter glass answer a different set of single-wavelength and interval questions under a different thickness condition.[2]
5. From Spectral Losses to Current and Power
Begin by counting photons. Consider a single-junction cell with its cover glass already bonded in place. Within a sufficiently narrow wavelength band, suppose 100 photons arrive at the cover glass and 80 pass through it. If 90% of those 80 photons then pass through the adhesive, 72 reach the illuminated surface of the cell. Assume that, in this assembled configuration, 60% of the photons reaching the cell result in charge collected by the external circuit.[8]
On average, the collected charge is equivalent to 72 × 0.60 = 43.2 electrons. A fractional value is possible because this is an average. The values of 80%, 90%, and 60% are illustrative assumptions. Each step follows the same assembled optical path. Using the original 100 incident photons as the denominator gives a conversion ratio of 43.2% for the complete assembly in that wavelength band.
This ratio is the external quantum efficiency, or EQE: at a specified wavelength, it describes the average number of electrons’ worth of charge collected in the external circuit per photon incident at the defined optical reference plane. “External” means counting begins with photons arriving from outside the device. Reflection, absorption, and charge-collection losses after that reference plane are included in the result.[8][14]
For a bare cell, the reference plane is on its illuminated side. For a covered assembly, it is at the outer surface of the cover glass. Bonding also replaces the original air–cell interface with an adhesive–cell interface, changing surface reflection. The actual assembled combination can therefore be evaluated by directly measuring assembly EQE, incorporating the cover glass, adhesive, bonded interfaces, and cell charge collection into one measured curve.[3][8]
Next, extend the calculation from a narrow wavelength band to the full solar spectrum. For a single-junction cell, or one subcell in a multijunction device, the relationship can be written as:
Jph ≈ q ∫ Φ(λ) EQEassembly(λ) dλ
Here, Φ is the solar photon flux spectrum incident on the cover glass: the number of photons arriving per second, per square meter, per nanometer of wavelength. EQEassembly is the measured response referenced to the cover glass’s outer surface.[8]
In the equation, λ is wavelength and q is the magnitude of the electron charge, approximately 1.602 × 10⁻¹⁹ coulombs. The integral adds contributions from all the narrow wavelength bands. Multiplying photon flux by EQE and electron charge, then summing over wavelength, gives the photogenerated current density Jph in amperes per square meter. Because assembly EQE already includes losses along the optical path, it can be multiplied directly by the incident photon flux spectrum.[8]
This also explains why the 91.3% transmittance at 400 nanometers must be considered within the full spectrum. Sunlight supplies different numbers of photons at different wavelengths, and the cell collects charge with different efficiencies across those wavelengths. A 10% optical loss in a band where the cell responds weakly may have little effect on total current. A loss in a sensitive subcell’s main absorption band can have a much larger effect. Calculations should use the spectrum, temperature, and post-irradiation response appropriate to the mission.[2][8][13]
Multijunction cells contain several subcells with different absorption bands, so their EQE must be measured separately. When measuring one junction, bias light at other wavelengths illuminates the remaining subcells, allowing them to generate sufficient current without limiting the signal from the junction under test. An appropriate voltage bias may also be applied when necessary. Scanning the probe light wavelength then provides the target subcell’s response point by point.[14]
These subcells are electrically connected in series, so the same current flows through each of them in the external circuit. Suppose a particular spectrum produces photogenerated current densities of 18, 17, and 20 milliamperes per square centimeter in the top, middle, and bottom junctions, respectively. In a conventional current-matching analysis, the middle junction becomes the current-limiting junction.[13]
If a different cover glass reduces transmission in the shortwave band mainly used by the top junction, the corresponding values might become 16, 17, and 20 milliamperes per square centimeter. The top junction then becomes limiting. These hypothetical values show why the location of a spectral loss matters as much as its magnitude.[13]
Improving light delivery to a limiting or nearly limiting subcell generally offers greater scope to increase series output current. Changes in the photogenerated current of other subcells can also affect total power through their voltage contributions. After calculating each junction’s response, engineers must therefore examine the complete cell’s current–voltage, or I–V, curve. NREL’s report on multijunction cell measurement emphasizes that mismatch between the simulator spectrum and subcell responses changes the measured overall curve and efficiency.[13]
An I–V curve records output current I at different terminal voltages V. Electrical power at each operating point is P = IV. Multiplying current by voltage along the curve identifies the maximum power point. The estimated photogenerated current describes current-generation capability, while actual output after connecting a load depends on the operating point.[8][13]
Cover glass changes the incident spectrum; that spectrum changes the photogenerated current of each subcell; and the series connection and voltages together determine output power. Connecting these steps makes it possible to determine how much additional electricity a cover glass’s improved transmission actually delivers.[8][13]
6. How to Demonstrate That the Cover Glass Is Suitable
Selection begins by defining the mission spectrum, cell type, expected temperature, and service life, then establishing cover glass thickness and particle-protection targets. Candidate glasses should be compared at the same thickness, coating condition, and measurement interface. After bonding the actual adhesive and cell, measure the assembly EQE of each subcell and the complete cell’s I–V curve to connect material properties with electrical output.[2][3]
Environmental testing also requires comparison specimens. Coated glass coupons reveal changes in the glass and coating; adhesive sandwiched between glass sheets helps assess the adhesive; and complete cell assemblies show total output changes. Specimen materials and manufacturing processes should correspond to one another. Comparing spectra and electrical properties before and after irradiation helps identify where losses occur. A change in assembly power alone initially establishes only overall degradation.[3][10]
Ultraviolet testing examines filtering behavior, glass darkening, and loss of adhesive transparency. Electron and proton irradiation evaluates material and cell changes under the corresponding particle conditions. Before-and-after measurements should use consistent spectra, temperatures, and reference planes so that transmission changes can be related to changes in electrical output.[3]
The ECSS photovoltaic assemblies standard primarily applies to crystalline silicon and single- and multijunction gallium arsenide cells thicker than 50 micrometers. Ultrathin flexible cells and other emerging technologies require applicability requirements suited to their device and packaging characteristics.[3]
Routine ultraviolet verification under the standard builds on qualified material combinations with established long-term degradation data. New combinations first require longer engineering tests to establish that basis before qualification. Monitoring short-circuit current and measuring I–V curves at intervals also records how performance changes during exposure.[3]
The reason solar array cells often use cerium-doped cover glass lies in this measurable chain: attenuating shortwave ultraviolet radiation before it reaches the adhesive while preserving transmission in electricity-generating bands after irradiation. From the wavelengths absorbed by the glass, to the light transmitted by the adhesive, to the charge collected by each subcell, every step must ultimately be assessed through assembly output under mission conditions. The right choice is the complete combination of materials and solar cell.[1][2][3]
The same approach applies to a wider satellite project: component specifications become meaningful when assessed against the mission they must support. STARPATH GLOBAL connects international customers with China’s satellite manufacturing, payload, and assembly, integration, and test resources, helping turn mission requirements into practical procurement choices. For teams evaluating a custom satellite or its supporting test equipment, a discussion with STARPATH GLOBAL can help align technical requirements, verification needs, and budget with available supply options.
References
[1] NASA/JPL, Solar Cell and Array Technology for Future Space Science Missions, JPL D-24454, June 2002, p. 72 (PDF p. 76).
[2] SCHOTT, SCHOTT® Solar Glass 0787, English product datasheet, November 2025 edition.
[3] ECSS, ECSS-E-ST-20-08C Rev.2: Photovoltaic Assemblies and Components, April 20, 2023; primarily Sections 1, 8.1.2, 8.7.9, and 6.4.3.15.
[4] H. Ebendorff-Heidepriem and D. Ehrt, “Formation and UV absorption of cerium, europium and terbium ions in different valencies in glasses,” Optical Materials, 2000.
[5] A. M. Efimov et al., “Quantitative UV–VIS spectroscopic studies of photo-thermo-refractive glasses. II. Manifestations of Ce3+ and Ce(IV) valence states in the UV absorption spectrum of cerium-doped photo-thermo-refractive matrix glasses,” Journal of Non-Crystalline Solids, 2013.
[6] SCHOTT, SCHOTT® Solar Glass product overview, accessed October 12, 2026.
[7] G. A. Haynes, Effect of Radiation on Cerium-Doped Solar-Cell Cover Glass, NASA TN D-6024, December 1970.
[8] G. A. Landis and E. Haag, “Analysis of Solar Cell Efficiency for Venus Atmosphere and Surface Missions,” International Energy Conversion Engineering Conference paper, 2013.
[9] World Health Organization, Ultraviolet Radiation, ultraviolet wavelength classifications, accessed October 12, 2026.
[10] European Space Agency, “Sticky test for solar cells,” January 30, 2013; environmental simulation testing of cover glass adhesives.
[11] SCHOTT, Solar Glass 0787 Material Data Sheet, revised July 22, 2026, p. 9; composition reported on a raw-material oxide basis.
[12] N. Soga and M. Tashiro, “Role of Cerium Ions in Preventing the γ-Ray Induced Coloration of Glass,” Journal of the Ceramic Association, Japan, 1962, Vol. 70, No. 797, pp. 143–147.
[13] C. R. Osterwald et al., Effects of Spectral Error in Efficiency Measurements of GaInAs-Based Concentrator Solar Cells, NREL/TP-5200-60748, March 2014.
[14] T. Moriarty and K. Emery, Procedures at NREL for Evaluating Multijunction Concentrator Cells, NREL/CP-520-28270, 2000; multijunction spectral response measurement methods.