As the old saying goes, it’s better to catch a problem while it’s still small. For infrastructure such as railways, highways, bridges, tunnels, and buildings, many risks do not emerge suddenly.
Slopes may deform slowly over months or longer. Railway or road foundations may continue to settle. Unusual ground movement may occur around bridges and their approaches, while tunnel construction may affect the stability of surrounding ground. By the time cracks, settlement, or visible structural deformation appear, the situation may already require focused attention and intervention.
Engineering and maintenance teams often focus more on:: Where is the ground changing? Is that movement continuing? Where should we inspect first? Ground instruments track locations where sensors have been installed, while manual inspections identify visible cracks and local damage. Expanding monitoring coverage or increasing inspection frequency, however, requires additional staff, equipment, and maintenance. Along long transport corridors, across large built-up areas, and on hard-to-access slopes, regional observations can help narrow the search.
InSAR and multi-source remote sensing analysis provide evidence to support these decisions. Satellite radar images acquired over time track small ground movements, while geological, terrain, hydrological, construction, and field survey data help explain them. Combining this information with the locations of buildings, transport routes, and bridges helps identify potential hazards, prioritize areas for field checks, and focus detailed monitoring on locations that need continued attention.
Tracking Ground Movement with InSAR
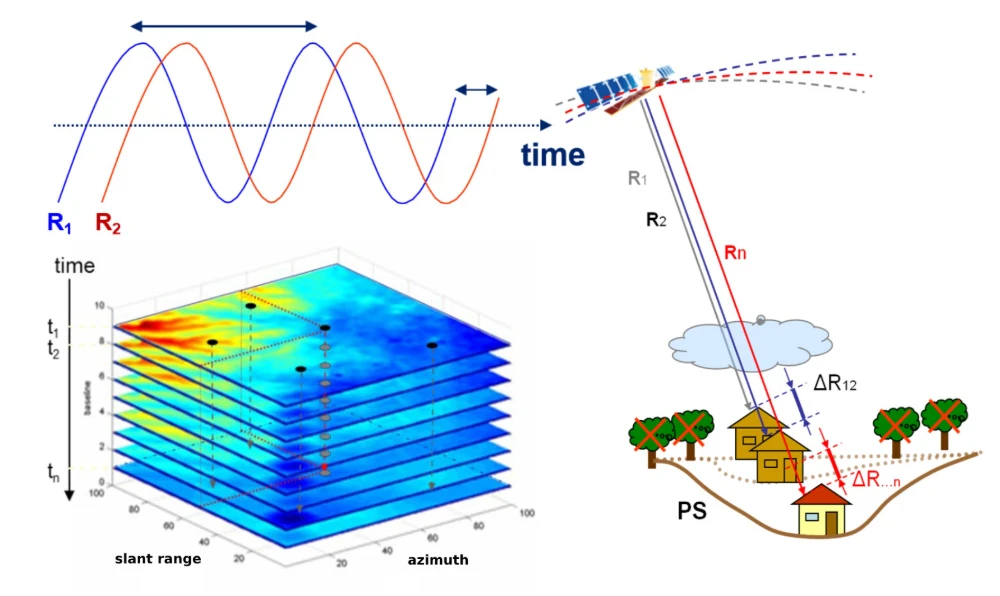
InSAR, or Interferometric Synthetic Aperture Radar, measures small ground movements by comparing radar images of the same area acquired at two or more points in time. When a ground target moves, its distance from the satellite changes. This change is reflected in the “phase” of the returning radar signal. After error correction and analysis of multiple observations, millimeter-scale deformation information can be obtained under favorable observation conditions and with appropriate quality validation. Radar does not depend on sunlight and is generally less affected by cloud cover than optical imaging, providing a basis for repeated observations.
Processing images acquired over time produces deformation maps, average movement rates, and cumulative displacement curves. Maps show where movement is concentrated, while time-series curves reveal how long it has continued, whether it has developed in distinct stages, and whether recent trends have changed.
Where the coverage and quality of archived imagery allow, it is also possible to examine ground movement before a project began. This provides context for understanding changes before and after construction, existing slope activity, or long-term ground subsidence.
InSAR typically measures relative movement toward or away from the satellite along the radar’s line of sight. Determining how much of that movement represents vertical settlement requires analysis of the satellite’s viewing geometry and additional data. Terrain shadowing, vegetation, and surface disturbance can also affect observations. Data and processing methods therefore need to suit the location, with findings at priority sites cross-checked against field surveys and ground monitoring.
Which Anomalies in Large Deformation Datasets Deserve Attention?
Regional InSAR analysis can produce vast numbers of observations. Large movements are easier to notice, but some clues to geohazards may lie in signals that are small, localized, or slow to develop.
The same amount of movement can have different implications for infrastructure depending on where it occurs. At one location, it may relate to construction disturbance; at another, it may indicate an active slope. Some observations may also be affected by atmospheric conditions, surface changes, or processing errors. A single colored point on a map or an inpidual movement rate is not enough to establish whether a location presents a geohazard.
Identifying small movements is only part of the task. The harder question is which signals deserve investigation—and what they could mean for nearby infrastructure.
STARPATH GLOBAL’s approach brings deformation analysis and geological interpretation into the same assessment workflow. We examine whether an anomaly persists over time, differs from surrounding ground, and forms a coherent spatial pattern. We then assess it alongside terrain, rock types, geological structures, drainage conditions, historical hazards, and construction activity.

multi-source data
For example, a small anomaly on a slope may warrant closer investigation when optical imagery shows a scarp, geological information indicates materials susceptible to weathering, and drainage conditions suggest concentrated infiltration. Each source adds evidence, while alternative explanations—including construction disturbance and measurement uncertainty—remain part of the assessment.
The practical advance is a more complete basis for deciding which anomalies matter. A displacement map becomes a set of locations with supporting evidence, possible explanations, and priorities for field verification.
The final step is to relate these locations to infrastructure. Buildings, railway sections, bridge approaches, and other assets are assessed against the potentially affected area and local engineering conditions. This helps teams decide where to inspect, where additional instruments may be needed, and which locations require continued observation.
Railway Slope Monitoring After Remediation: Bitong Line
Railway monitoring extends beyond the tracks. Ground deformation and geohazards can affect foundations, slopes, bridges, tunnels, stations, and buildings along the route. Monitoring therefore needs to cover both the wider corridor and specific areas of concern.
Movement on railway slopes may reflect a combination of geological conditions, nearby construction, and runoff during the rainy season. Understanding how these factors relate to the railway is as important as recording the movement itself.
An analysis of a slope within the Bitong Line’s designated protection zone found deformation rates ranging from −5.17 to +2.05 mm/year between January 2020 and September 2024, with a maximum cumulative subsidence of −31.10 mm.
The site lies in hilly terrain underlain by Jurassic red beds, mainly purplish-red siltstone and sandstone. Field investigation indicated that construction at a brick factory above the tunnel portal had altered local drainage. Rainwater accumulated near the railway during the wet season, contributing to the local landslide.
At the time of the case assessment, the site was classified as medium risk despite the remedial works already completed. Continued observation of the slope and protective measures was recommended to identify renewed movement or deterioration.

InSAR deformation velocity map, PS-InSAR time-series cumulative displacement, and field photographs of the railway side slopes within the control protection zone of the Bi-Tong Line.
InSAR documented the extent and rate of slope movement, while field surveys added information about construction and runoff. Together with the condition of the site after remediation, these findings help maintenance teams identify locations that still need tracking and compare subsequent observations with historical records.
Yunwushan Tunnel: Examining Regional Subsidence Alongside Cracks in Nearby Buildings
Tunnel construction and changes in surrounding ground and hydrological conditions may manifest as surface subsidence or slope deformation, potentially affecting nearby homes and roads. Visible cracks reveal local damage, but understanding whether movement extends across a wider area—and how long it has continued—requires more complete observations.
In the trough-shaped valley near the summit above Yunwushan Tunnel, we combined InSAR results, hydrogeological data, and field surveys to analyze ground subsidence and changes in the surrounding area. The area showed a subsidence trend from January 2020 to October 2024. InSAR results at point indicated a deformation rate of −21.74 mm/year and a cumulative displacement of −86.96 mm.

InSAR cumulative surface settlement map above Yunwushan Tunnel (Pre-construction Left; Post-construction Right)
The area is underlain by the Triassic Leikoupo Formation, consisting mainly of argillaceous limestone and limestone. Field surveys documented clear signs of uneven settlement, including ground collapse and cracks in houses and road surfaces.

Hydrogeological background data above the Yunwushan Tunnel and field photographs of structural cracking in nearby buildings.
InSAR added a quantitative record of ground movement that could be examined over time. Field surveys documented the physical condition of buildings and roads, while satellite observations supplied the spatial distribution, rates, and cumulative amounts of movement across the surrounding area. Together, they provided a spatial and temporal basis for further assessment.
GNSS sensors have also been installed for real-time monitoring at priority locations. Regional remote sensing and ground instruments serve complementary roles: the former shows spatial patterns and historical movement, while the latter continuously tracks specific locations. The InSAR values describe movement at the satellite measurement location; they are not direct measurements of settlement in an inpidual building. Nearby buildings require their own inspections and, where appropriate, dedicated monitoring.
Investigating Small Deformation Signals in Loess: A Gansu Pipeline Case
Small amounts of deformation still need to be understood in their geological setting. In a loess area along a pipeline in Gansu, multi-source analysis helped clarify the relationship between ground movement, subsurface cavities, and collapse.
The cumulative subsidence of −8.79 mm at InSAR measurement point between January 2021 and July 2024. Located approximately 2 meters from the pipeline, the point lies near the transition from a loess plateau to a riverbank slope. This small movement needed to be assessed alongside the local terrain, groundwater conditions, and evidence from field investigation.
Field surveys found multiple soil cavities, some connected to one another, as well as continuous seepage from a sand and gravel layer at the foot of the slope. Considering the loess deposits, riverbank landforms, and hydrology, the investigation linked these features to factors including infiltration from irrigation or rainfall and river erosion. Some cavities around and beneath the pipeline showed signs of further development, presenting hazards that required attention.
Further geophysical investigation identified severe collapse, voids, and loosely compacted loess approximately 5–8 meters beside the pipeline. The responsible management organization implemented engineering measures to backfill the pipeline trench.

InSAR cumulative surface deformation map, PS-InSAR displacement time series, and field photographs of hollows and collapses near a pipeline in a loess area.
In this case, InSAR provided evidence of ground movement, field and geophysical investigations clarified the cavities and collapse, and the management organization subsequently carried out backfilling. For infrastructure in areas with complex ground conditions, this combination connects regional observations with investigation and treatment at specific locations.
Matching InSAR Methods to the Monitoring Task
Built-up areas, exposed rock, vegetated slopes, and construction sites differ in their radar scattering conditions and patterns of movement. Method selection needs to account for the target, the scale of change, available historical imagery, and observation conditions.
These processing approaches may be combined within a monitoring workflow; their suitability depends on the site and available imagery.
Buildings and exposed rock, for example, can provide relatively stable radar returns, while usable measurement points may be sparse in some non-urban areas. PS-InSAR typically provides denser measurements in urban areas and on exposed rock, with fewer usable points in areas with weaker radar coherence. JS-InSAR uses information from neighboring pixels to improve signal quality and increase measurement coverage in these areas. As shown in the figure below, a comparison of the PS-InSAR and JS-InSAR time-series point cloud results at a station in Sichuan reveals that the point cloud density of JS-InSAR (right) is significantly higher than that of PS-InSAR (left). Consequently, JS-InSAR captures much richer ground deformation details, demonstrating its superior applicability in mountainous regions characterized by dense vegetation cover.

PS-InSAR time-series point cloud results (left) versus JS-InSAR time-series point cloud results (right).
These methods address different observation needs. Regional screening requires a picture of the overall distribution of movement, while long-term tracking at priority locations requires consistent time series. Appropriate processing, quality control, geoscientific interpretation, and field verification turn deformation results into information that supports engineering decisions. Where needed, ascending and descending satellite passes—which observe the same area from different orbital directions—can provide additional information, alongside optical imagery and ground monitoring.
Bringing Monitoring Results into Inspections and Infrastructure Management
Different assets require results to be presented in different ways. Railway teams need anomalies linked to route chainage, foundations, and slopes. Building managers need to understand surrounding ground movement and its location relative to inpidual properties. For bridges, attention needs to cover observable parts of the structure, ground near the abutments, and slopes on both banks.
Outputs can include regional deformation maps, prioritized anomaly lists, displacement time series, and integrated interpretation reports. Field findings can then feed into subsequent analysis to update priority locations, risk assessments, and monitoring plans.
At sites where remediation has been completed, follow-up observations provide an ongoing record of movement to support reviews of protective measures and decisions about further investigation. At locations requiring frequent observations, periodic satellite analysis can be combined with GNSS, leveling surveys, crack monitoring, and other field methods to interpret changes within a shared spatial and temporal context.
Turning Satellite Deformation Data into Actionable Risk Information
For teams monitoring infrastructure across large areas, along extended corridors, or in complex terrain, the practical need is a solution that connects satellite data, change detection, risk analysis, and field monitoring.
This requires matching data selection to the monitoring task. Regional screening and detailed analysis of priority locations have different requirements for image resolution, coverage, observation frequency, and historical records.
STARPATH GLOBAL can recommend suitable satellite imagery and processing methods based on asset type, terrain, and monitoring objectives. By meeting the analysis requirements while limiting unnecessary acquisition and processing costs, we help direct budgets toward information that improves decisions. For buildings, railways, bridges, and their surrounding geological environments, we coordinate satellite data acquisition, InSAR processing, multi-source interpretation, and delivery of results, connecting these services with customers’ existing inspections, field investigations, and monitoring activities.
For teams with limited satellite remote sensing experience, STARPATH GLOBAL’s Forward Deployed Engineer (FDE) services provide support with defining requirements, designing solutions, and validating applications. This helps establish where remote sensing can contribute and whether further deployment is worthwhile.
If you are considering satellite monitoring for infrastructure management, apply to join STARPATH GLOBAL’s Pioneer Partner Program. Our engineers can work with your team to assess application opportunities and turn specific monitoring needs into a practical solution.