A dark patch appears in a radar image near a shipping lane. Is it oil, calm water, or another surface feature? For a maritime duty officer, the useful first answer is often “possible oil slick.” The next step is to test that interpretation against sea conditions, later observations and activity records before attributing it to an incident or a source.
Why Oil Can Look Dark in SAR Imagery
Synthetic aperture radar (SAR) measures the strength of signals returned from the sea surface. Wind creates short waves that scatter radar energy back toward the satellite. A floating oil film can dampen those waves, reducing the return and producing a dark shape against surrounding water. SAR can acquire images at night and through cloud cover, making it valuable for offshore screening when optical imagery is unavailable.
The dark shape is a measurement of reduced radar backscatter, not a direct chemical measurement of oil. SAR alone generally cannot establish whether a film is petroleum, another substance, or a natural surface slick.
Compare the Dark Areas Before Naming Them
A useful real-world comparison comes from ESA’s Sentinel-1 image acquired north of Corsica on 8 October 2018. A reported collision between two merchant ships provides independent context for one dark oil slick. ESA also cautions that other dark areas in the image have low radar reflectivity and may represent very calm water. Placing labeled crops of these areas side by side shows why color alone cannot settle an alert.
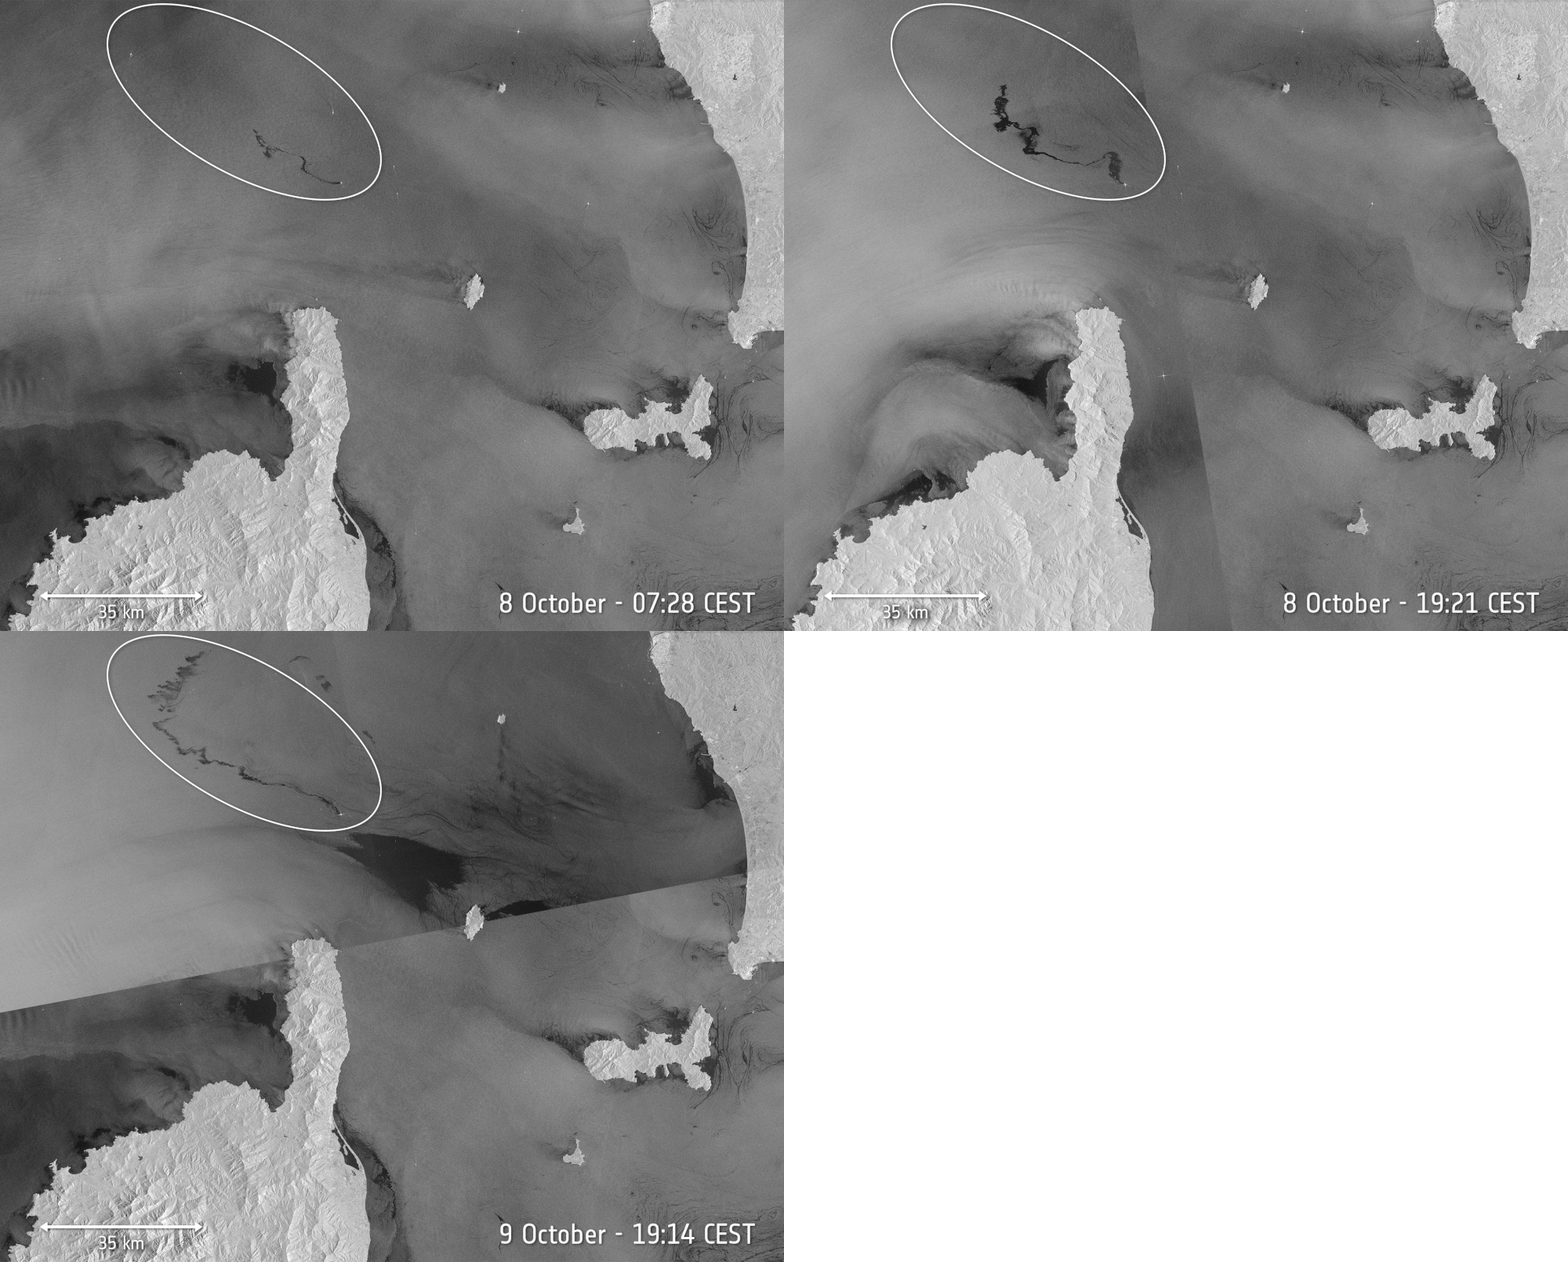
The white circle marks the oil slick. The large black area to its southeast is calm water with low radar reflectivity, according to the European Space Agency (ESA).
Other look-alikes include natural films produced by biological activity, low-wind areas in the lee of islands, current patterns, rain effects and some ship wakes. A wake or a narrow streak near a vessel deserves investigation, but its shape and proximity do not identify the material—or prove that the vessel discharged it.
A Practical Review Sequence for a Suspected Slick
1. Record the candidate and its acquisition time
Preserve the original SAR scene, acquisition time, location, sensor details and outline of the dark area. Inspect the surrounding water as well as the patch. A sharply outlined streak on a textured sea may merit attention; a broad region that follows a calm-water boundary may point to a different explanation. Shape is a clue, not a verdict.
2. Check wind and sea conditions
Compare the image time with local wind observations or a suitable wind analysis, and examine nearby sheltering coastlines, islands and weather systems. Very light wind can make clean water dark and reduce the contrast needed to detect oil. Strong winds and rough seas can also make a surface slick harder to recognize. Treat a poor observation window as uncertainty, not as evidence that pollution is absent.
3. Seek another observation
Where timing and conditions allow, compare optical imagery or a subsequent SAR acquisition. An optical view may provide additional information about a visible surface film, but sun glint, clouds and other floating material can complicate it. A later radar scene can show whether the feature moves, disperses or persists. Because winds and currents move surface material between acquisitions, the review must account for the time gap.
4. Compare vessels and facilities with the image time
Review AIS tracks, SAR-detected vessels, offshore facilities, incident reports and relevant operating records. Align every record with the satellite acquisition time before judging whether a track and a slick are consistent. An AIS match can identify a vessel worth investigating; an AIS gap does not establish that an untracked vessel caused the feature.
5. Escalate for expert and field review
A trained analyst should document both supporting evidence and plausible alternatives. When the decision carries operational or enforcement consequences, aircraft, vessel inspection, sampling, facility records or an authority-led investigation may be needed to determine what the material is and where it came from.
What Can the Alert Actually Claim?
Even when an oil slick is established, its mapped surface area does not directly reveal the volume released. The film’s thickness varies, and a single SAR image does not measure that thickness across the patch. Likewise, a nearby bright vessel target or matching track is evidence to examine, not a finding of responsibility.
From Alert Review to Response
The purpose of screening is to direct attention quickly while keeping the evidence honest. A candidate dark patch can justify a closer look; combined imagery and incident records can strengthen an association; confirmation of the pollutant and its source requires a further investigation. Once an incident is established, repeated observations can help track its movement and potential coastal exposure, as discussed in our Oman oil-slick analysis.
For ports, offshore operators and maritime authorities, STARPATH GLOBAL can bring SAR imagery together with optical observations, weather information and vessel activity in a reviewable monitoring workflow. If you are designing an oil-slick alert process, contact our team to discuss the area, evidence requirements and response timeline.
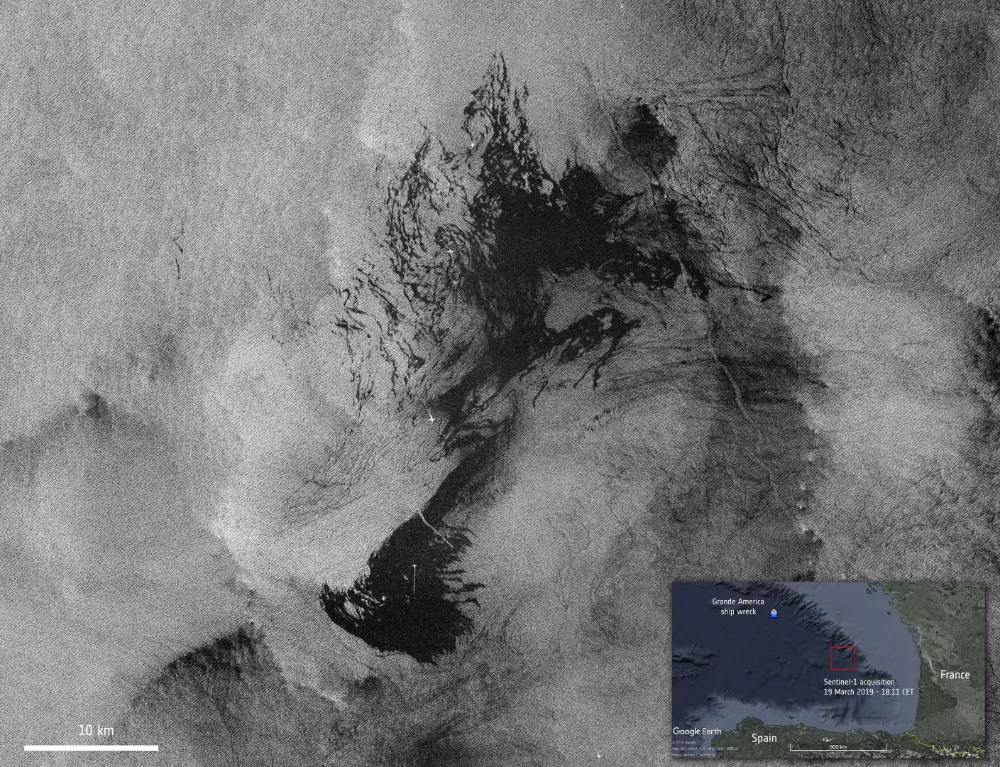
Feature image: Copernicus Sentinel-1 image of the oil spill from the Grande America vessel, acquired on 19 March 2019. The large dark patch shows the slick in the context of a documented maritime incident. Credit: Contains modified Copernicus Sentinel data (2019), processed by ESA.