Research into extreme weather and climate events has no shortage of individual forecasting algorithms. The harder challenge is identifying warning signs in noisy Earth observation data with inconsistent scales and few examples of extremes, tracing the mechanisms behind those signals, and translating predictions into credible, actionable risk information. Focusing on floods, droughts, heatwaves and wildfires, the review by Camps-Valls and colleagues examines AI’s role across event detection, prediction, impact assessment, understanding of mechanisms and warning communication. Rather than introducing a new “best-performing model,” it sets out a research framework connecting remote sensing, Earth system science and disaster management.[1]
Four types of extremes: Droughts, heatwaves, wildfires and floods. These are the review’s four groups of case studies, not an experimental sample count.
Examples of conventional statistical definitions: The outermost 1% or 5% of a probability distribution. The paper uses these examples to illustrate the limitations of single-variable thresholds, not as a common criterion adopted throughout the review.
Global economic losses from flooding: More than US$40 billion annually. This is a background estimate cited in the review, not a result calculated by a model developed in the paper.
Potential benefits of improved flood detection and early warning: Up to a 40% reduction in fatalities. This is a background statement about disaster risk reduction, not a measured outcome of the review.
The 2021 European floods: Nearly 200 deaths in Germany’s Ahr River region, despite rainfall forecasts issued about two days in advance. The example illustrates why an advance forecast does not necessarily become an effective warning.
1. The Operational Challenge: Why Knowing Extreme Weather Is Coming Is Not Enough
In remote sensing, mapping and disaster monitoring, satellite imagery, weather observations, reanalysis data and terrain information can describe conditions on the ground. But an “extreme” is more than high temperatures, low rainfall or an anomalous pixel. Whether an event becomes an extreme disaster often depends on its duration, location, interactions among environmental variables, and the vulnerability of exposed people and assets. The review notes that defining extremes as the outermost 1% or 5% of a probability distribution cannot fully capture this multidimensional context.[1]
Data introduce further difficulties. Truly rare disasters offer few examples with expert annotations. Satellite and ground observations differ in temporal resolution and spatial scale, while clouds, missing observations and noise affect model inputs. Routine data cleaning can even remove the rare but important outliers that researchers need to study. AI-based disaster analysis must therefore preserve extreme signals while maintaining data quality, rather than optimizing prediction errors only under average conditions.[1]

A general Artificial Intelligence (AI) driven extreme event analysis pipeline.
Figure 1 traces a complete workflow from data collection and preprocessing through machine learning, computer vision, explainable analysis and causal inference to predictions, spatiotemporal patterns, attribution and causal relationships. Its feedback loops are particularly relevant: outputs can help revise research hypotheses and data processing procedures as well as inform users. This is a conceptual workflow, not a standalone model validated through controlled experiments.[1]
2. Data and Methods: Bringing Multisource Remote Sensing into AI Analysis
The inputs discussed in the review extend beyond optical satellite imagery to include climate variables, in situ measurements, reanalysis data, and supporting information on terrain, vegetation and land conditions. Data requirements vary by task. Drought analysis emphasizes soil moisture, precipitation, temperature and vegetation condition. Wildfire analysis also requires fuel conditions and weather drivers, while flood assessment depends heavily on river channels and local terrain.[1]
The authors organize extreme event modeling into three main tasks. Detection asks where and when an anomaly occurs, using approaches such as outlier detection, one-class classification, reconstruction error analysis or probabilistic models. Prediction asks what happens next, encompassing deterministic and probabilistic forecasts, recurrent neural networks, and methods that integrate physical processes. Impact assessment asks what consequences follow, ranging from changes in vegetation condition to effects on agriculture, infrastructure and affected populations.[1]
A distinction is essential here: methods discussed in a review are not necessarily methods implemented by its authors. The paper surveys autoencoders, ConvLSTM, Transformers and physics-informed models, but does not retrain and rank them on a common dataset. Its Table 1 presents a classification of tasks and methods, not a model accuracy leaderboard.[1][2]
3. Beyond Prediction: Explaining Why Events Happen and How Much to Trust the Results
A central contribution of the review is to place predictive capability and scientific understanding within the same technical framework. Detection, prediction and impact assessment address “what” questions. Explainable AI, causal inference, event attribution and uncertainty quantification extend the inquiry to “why,” “what if conditions changed,” and “how reliable is this assessment?”[1]
Explainable AI can reveal which inputs a model relies on. Feature attribution, for example, can examine how temperature, soil moisture or vegetation condition influence drought detection. But feature importance does not establish causation: a model’s reliance on a variable does not, by itself, prove that the variable physically caused an event. Causal analysis and counterfactual scenarios require additional assumptions, data and scientific validation.[1]
Uncertainty is equally important. The paper distinguishes aleatoric uncertainty, arising from the inherent variability of natural processes, from epistemic uncertainty, arising from gaps in model knowledge. More training data alone cannot eliminate the former, while better data and models may reduce the latter. Warning systems also need calibrated event probabilities; otherwise, outputs that appear highly confident can still lead to mistaken judgments.[1]

Components in an Artificial Intelligence (AI) pipeline for extreme events.
Figure 2 organizes the technical framework into three layers. Detection, prediction and impact assessment sit at the top; explanation, causality, attribution and uncertainty quantification occupy the middle; and operational deployment, risk and ethical considerations, and decision support form the bottom layer. For remote sensing practitioners, the implication is that a disaster map becomes more useful for decisions when it includes explanations of underlying drivers, uncertainty information and a clear application context.[1]
4. Four Hazard Types: What AI Can Help Solve—and What It Cannot Guarantee
Droughts: Conventional monitoring often applies thresholds to meteorological, hydrological and vegetation indicators. The review discusses models that combine satellite imagery, climate variables and static geographic features, including approaches such as domain-informed variational autoencoders to identify droughts and their drivers. Challenges include overlapping drought types, long event durations and a shortage of high-quality labels.[1]
Heatwaves: Heat extremes are associated with atmospheric circulation, land–atmosphere interactions and other factors. The paper surveys dimensionality reduction, feature selection, deep learning and causal analysis, emphasizing the need to identify signals that support advance prediction while avoiding distortions in the tails of distributions. Predicting a period of extreme heat and explaining its drivers remain distinct scientific tasks.[1]
Wildfires: Satellite observations, weather data, vegetation and terrain information can help estimate fire danger, potential burned area and associated impacts. The paper also makes clear that ignition depends on factors that are difficult to observe comprehensively, including dry thunderstorms and human activity. AI therefore cannot be claimed to predict every ignition accurately. The review also discusses the detection and causal understanding of wildfire-generated pyrocumulonimbus clouds, or pyroCb.[1]
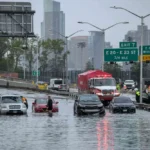
Floods: Flooding demonstrates why forecast lead time does not automatically translate into effective disaster prevention. In the review’s account of the 2021 European floods, heavy rainfall was forecast about two days ahead, but flooding in small catchments, floating debris and changes in river morphology complicated risk assessment and response. The authors consequently emphasize combining terrain, channel conditions and inundation modeling with visual and language-based risk communication for the public.[1]

Summary of case studies using Artificial Intelligence (Al) to manageextreme events.
Figure 3 presents representative technical workflows for droughts, heatwaves, wildfires and floods in four panels. Elements particularly relevant to remote sensing applications include multisource land surface data in the drought panel, risk and uncertainty maps in the wildfire panel, and the combination of satellite imagery, flood extent maps and visual warnings in the flood panel. These are illustrations of reviewed case studies, not a new set of quantitative comparative experiments conducted for this paper.[1]
5. Quantitative Evidence and Limitations: Disaster Statistics Are Not Model Performance Results
The paper includes figures such as annual flood losses exceeding US$40 billion, potential reductions in flood fatalities of up to 40% through improved detection and early warning, and nearly 200 deaths during the 2021 European floods. These figures represent different types of evidence: the first two are background estimates or statements about disaster risk reduction, while the third describes a historical event. None is an accuracy, recall or error-reduction result produced by a common AI model developed by the authors.[1]
Readers may want to know how much a model improves on conventional algorithms, how many samples a test set contains, which forecast lead time performs best, or what spatial resolution the input imagery requires. This review provides no single experimental answer that applies across hazards. Nor does it introduce a common mathematical formula that can be extracted for general use. Any account of the paper should therefore avoid adding loss functions or comparison tables that it does not contain, or attributing results from other studies to this review.[1][2]
6. Scientific Contribution, Practical Boundaries and Implications for the Industry
The paper’s scientific value lies less in setting a new performance record than in defining a broader role for AI in extreme events: systems should detect anomalies, explain drivers, represent uncertainty and support risk communication. It connects data fusion and thematic mapping—familiar tasks in remote sensing—with causal science, reliability assessment and disaster governance.[1]
The limitations are clear. Extreme event samples are scarce, and definitions vary. Historical distributions may no longer describe future conditions. High-quality ERA5 reanalysis data or cloud-free satellite imagery differ from the imperfect forecasts and cloudy observations available during deployment. Explainable analysis may remain correlational, while higher predictive accuracy does not necessarily improve public response or management decisions.[1]
For remote sensing and mapping practitioners, the more useful next step is to establish traceable data sources, explicit hazard definitions, testing under distribution shifts, credible representations of uncertainty, and outputs that emergency management teams can understand and use. Moving from “predicting a map” to “explaining a disaster and supporting action” is the review’s most consequential direction.
Putting that approach into practice requires satellite observations, analysis and alerts to work together. STARPATH GLOBAL combines in-house software development with multisource satellite data to turn changing conditions on the ground into monitoring layers, alerts and information for operational review. Organizations exploring a monitoring service can talk to our team about the hazards, assets and response timelines that matter to them, helping match data resolution, update frequency and platform functions to their needs and budget.
References and Figure Use Notes
[1] Camps-Valls, G., Fernández-Torres, M.-Á., Cohrs, K.-H., et al. (2025). Artificial intelligence for modeling and understanding extreme weather and climate events. Nature Communications, 16, Article 1919. https://doi.org/10.1038/s41467-025-56573-8
[2] Publisher’s official PDF: https://www.nature.com/articles/s41467-025-56573-8.pdf
Original title: Artificial intelligence for modeling and understanding extreme weather and climate events
Authors: Gustau Camps-Valls, Miguel-Ángel Fernández-Torres, Kai-Hendrik Cohrs, Adrian Höhl, Andrea Castelletti, Aytac Pacal, Claire Robin, Francesco Martinuzzi, Ioannis Papoutsis, Ioannis Prapas, Jorge Pérez-Aracil, Katja Weigel, Maria Gonzalez-Calabuig, Markus Reichstein, Martin Rabel, Matteo Giuliani, Miguel D. Mahecha, Oana-Iuliana Popescu, Oscar J. Pellicer-Valero, Said Ouala, Sancho Salcedo-Sanz, Sebastian Sippel, Spyros Kondylatos, Tamara Happé and Tristan Williams — 25 authors in total
Journal: Nature Communications
Year, volume and article number: 2025, Volume 16, Article 1919
DOI: 10.1038/s41467-025-56573-8
Publication history: Received June 13, 2024; accepted January 23, 2025; published online February 24, 2025
Article type: Review Article