Satellites can help estimate soil organic carbon and map its spatial variation, but they do not directly measure the carbon stored throughout a soil profile. Optical sensors observe the exposed surface or the vegetation above it. Turning those observations into a soil carbon estimate requires a model, representative soil samples and independent validation.
For agricultural businesses, land managers and carbon project developers, the practical question is therefore not simply whether a satellite can “see carbon.” It is which carbon quantity the project needs, what supporting measurements are available, and whether the uncertainty is small enough to support the intended decision.
Carbon Concentration, Stock and Change Are Different Quantities
Soil organic carbon, or SOC, is the carbon contained in soil organic matter. It is distinct from inorganic carbon in materials such as carbonates. Three quantities are commonly discussed, and they require different evidence.
A concentration of 1% does not specify how much carbon a hectare contains. The answer also depends on how much dry soil is present and how deeply it is assessed. Likewise, a map of current carbon stock does not establish how much carbon has accumulated since a farming practice changed.
Two Ways Satellites Support Soil Carbon Estimates
1. Estimating Carbon from Exposed Soil Spectra
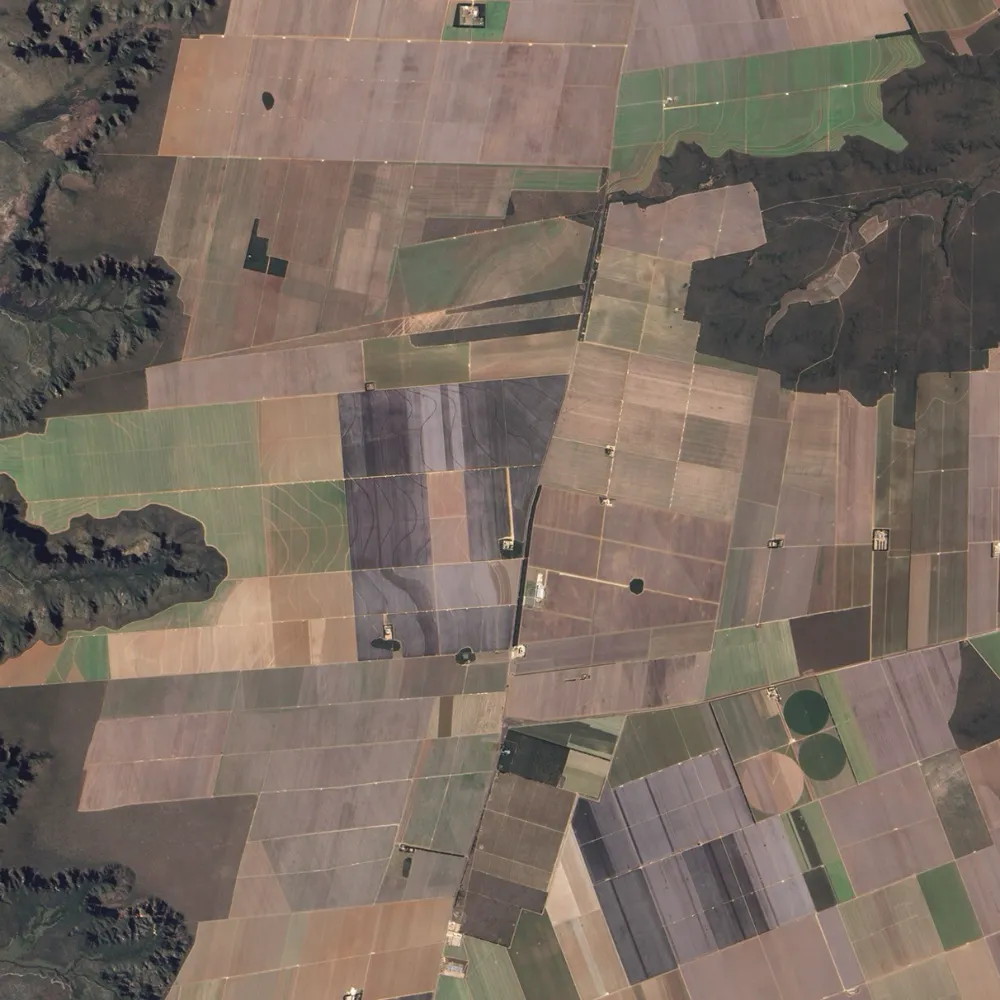
When soil is sufficiently exposed, optical satellites measure its reflectance across different wavelengths. Organic matter influences that reflectance, alongside minerals, texture, moisture and surface conditions. Researchers can train statistical or machine learning models to relate these measurements to laboratory-tested SOC concentrations.
Multispectral imagery provides selected wavelength bands. Hyperspectral imagery provides many narrower bands and can help distinguish spectral information that broader bands combine. However, additional bands do not remove the need for soil samples or make the signal uniquely attributable to organic carbon.
A 2022 study in Remote Sensing compared Landsat 8, Sentinel-2 and PRISMA imagery for predicting soil properties in two agricultural areas in Italy. PRISMA produced better SOC predictions from actual satellite imagery in that experiment. This supports evaluating hyperspectral data where suitable bare soil is available; it does not establish a universal accuracy level for other regions or soil conditions.
The depth limitation is critical. Reflected sunlight carries information about a thin surface layer. A model trained against samples collected from 0–30 cm may predict an average concentration for that interval, but it does so through an empirical relationship. The satellite has not observed the entire 30 cm profile.
2. Predicting Carbon from Environmental Variables
Where soil is covered, satellites can still provide variables associated with soil carbon: vegetation patterns, land cover, seasonal growth and aspects of surface moisture. Models combine these with climate, terrain, geology, management information and measured soil properties.
This approach is commonly called digital soil mapping. It estimates carbon from relationships between sampled soils and their environmental setting. A vegetation index is therefore a model input, rather than a direct soil carbon measurement.
SoilGrids 2.0 illustrates this distinction. Its published workflow used approximately 240,000 soil observation locations and more than 400 environmental covariates to produce global soil property maps at 250 m resolution, with quantified uncertainty. Such products provide useful regional context, but require local assessment before supporting field-level decisions.
Resampling a 250 m prediction map to 10 m does not create new soil measurements. Similarly, a greener crop or a higher vegetation index cannot, on its own, establish that soil carbon increased.
Why Surface Conditions Matter
Several factors can change the observed signal without representing a change in SOC:
- Vegetation: leaves and stems obscure the soil and contribute their own spectral response.
- Crop residues: straw, stubble and other surface material can contaminate a bare soil signal, including where green vegetation is sparse.
- Moisture: wet soil changes reflectance and absorption features. Laboratory spectroscopy experiments have demonstrated that moisture can interfere with SOC prediction.
- Soil differences: clay, iron oxides, carbonates and texture affect spectra and can weaken a model transferred from another region.
- Surface roughness: tillage, clods and shadows alter reflectance and observation geometry.
Image selection should therefore consider exposed soil, residues and moisture as well as clouds. Combining several dates can improve the availability of suitable observations, but a composite assembled across multiple seasons or years must be labelled accordingly. It is not a measurement from one specific date.
Synthetic aperture radar can provide complementary information related to moisture, roughness and vegetation. It should not be interpreted as a direct measurement of organic carbon stored below the surface.
What Ground Measurements Are Required?
A useful sampling plan begins with the intended output. Mapping SOC concentration, estimating a baseline stock and detecting stock change require different sampling designs and levels of precision.
Define and Record Sampling Depth
Every sample must have a documented depth interval. A 0–10 cm sample cannot automatically represent 0–30 cm, and an increase near the surface may not represent an increase across the assessed profile. Where several layers are sampled, calculate their stocks separately before combining them.
Measure Bulk Density and Coarse Fragments
Bulk density converts a soil volume into dry soil mass. Stones and other coarse fragments also need appropriate treatment because SOC concentration is commonly measured on the fine-earth fraction.
For a simplified illustration with no coarse fragments, soil containing 10 g C/kg, with a bulk density of 1.2 g/cm³ across a 30 cm layer, contains:
SOC stock = 10 × 1.2 × 30 × 0.1 = 36 t C/ha.
This is an illustrative calculation, not a satellite-derived result. An operational calculation must use consistent definitions for bulk density and coarse fragments. Any estimated rather than measured inputs should be identified.
Use Consistent Laboratory Analysis
Laboratory testing provides the reference values for calibration and validation. The analytical method must distinguish organic carbon from inorganic carbon where carbonates are present. Dry combustion measurements of total carbon may require additional treatment or measurement to obtain SOC.
Sample preparation, analytical methods and quality controls should remain comparable between campaigns. Changing laboratory procedures can introduce differences that resemble environmental change.
Match Samples to the Image Footprint
A soil core represents a much smaller area than a satellite pixel. Sampling must account for within-field variation and avoid pairing a small, unrepresentative sample with a mixed pixel containing soil, crops, tracks or field edges. Record locations, dates, management conditions and the sampling support used to represent each area.
How Should Model Uncertainty Be Reported?
A practical deliverable should include both a prediction and an explanation of how much confidence to place in it. At minimum, report:
- The target: concentration, stock or stock change, with units and depth intervals.
- The evidence: imagery dates, sample coverage, laboratory methods and supporting variables.
- Validation performance: errors in the original units, systematic bias and performance across relevant soil or land-use groups.
- Spatial uncertainty: prediction intervals or another clearly defined uncertainty measure, plus areas outside the model’s supported conditions.
- Stock uncertainty: the effects of concentration, bulk density, coarse fragments and sampling variability.
Validation samples should be independent of model fitting. Repeated observations from the same sampling location should not be distributed between training and testing in a way that makes the test artificially easy. Where the intended use involves new fields or regions, validation should test that transfer explicitly.
A pixel prediction interval and uncertainty in the average stock across a whole project area are different quantities. Project totals require an aggregation method that accounts for spatial dependence; errors do not necessarily cancel simply because many pixels are averaged.
Why Two Prediction Maps Do Not Prove New Carbon Sequestration
Subtracting one predicted map from another produces a numerical difference. That difference may reflect actual change, but it can also reflect moisture, surface cover, image processing, sampling differences or a revised model.
Repeated stock assessments must also account for changing bulk density. Compaction or expansion changes the amount of soil within a fixed depth. Equivalent soil mass methods can help make comparisons on a consistent mass basis rather than treating this physical change as a carbon gain or loss.
Monitoring should be designed around the expected change and the uncertainty of the method. If the estimated increase cannot be distinguished from that uncertainty, report the evidence as inconclusive rather than presenting a confirmed gain.
Carbon crediting adds further requirements. A defensible claim must follow the applicable methodology, establish a baseline and address attribution, additionality, uncertainty and permanence. Satellite observations can support this evidence chain, but a prediction map alone does not demonstrate an eligible carbon removal.
Verra’s digital soil mapping tool illustrates the role models can play: it provides requirements for developing, calibrating and validating spatial SOC estimates, including uncertainty. The availability of such a tool does not make an arbitrary satellite map suitable for credit issuance.
Our related article on satellite carbon monitoring discusses broader atmospheric and carbon project applications. Soil carbon requires a distinct measurement approach because the quantity of interest is stored within the soil profile.
Building a Useful Soil Carbon Assessment
For many projects, the first useful outputs are maps of suitable observation areas, environmental zones and sampling priorities. Quantitative SOC predictions can follow where representative measurements and independent validation support them. Stock estimates require the additional soil mass information, while change assessments require a repeatable monitoring design.
STARPATH GLOBAL brings together satellite resources, data processing and AI interpretation to support agricultural and environmental workflows. If you are planning a soil carbon assessment, contact our team to discuss imagery selection and how Earth observation could complement your sampling and verification plan. The quantitative scope should be defined around available ground evidence, local validation and the decisions the results need to support.