A forest biomass map can show convincing patterns without providing reliable estimates for a particular project. Before using it to assess forest resources or support carbon monitoring, the essential question is whether its predictions agree with independent reference data at the scale and date that matter.
Validation requires more than extracting map values at forest plot coordinates. Field plots, satellite lidar footprints and raster pixels often represent different areas, observation dates and biomass definitions. Their uncertainties also differ. A useful assessment must resolve these differences before calculating accuracy statistics.
Define What You Are Validating
Four quantities need to be kept separate:
- Aboveground biomass density: dry biomass per unit area, commonly expressed in megagrams per hectare, or Mg/ha. One megagram equals one metric tonne.
- Total aboveground biomass: biomass within a defined project boundary, expressed in Mg.
- Aboveground biomass carbon stock: the carbon contained in that biomass, estimated using an appropriate carbon fraction.
- Stock change: the difference between comparable stock estimates for two dates.
Check which vegetation components each dataset includes, such as live trees, standing dead trees, shrubs or foliage, and any minimum stem-diameter threshold. An aboveground biomass product does not automatically include roots, soil carbon, litter or deadwood.
Also define the reporting area. Mean biomass density across an entire landscape differs from mean density within forest alone. Applying a forest-only average to the full project area can substantially overstate the total.
Our overview of satellite carbon monitoring explains the broader observation methods. Here, the focus is on testing forest aboveground biomass estimates.
Field Plots and GEDI Both Have Uncertainty
Forest inventories usually estimate tree biomass from measurements such as stem diameter, height and species or wood density, using allometric equations. Measurement errors, missing trees, uncertain wood density and equations applied outside their calibration range can all affect plot estimates.
Record the field protocol, equations, plot area and uncertainty information. A reference value without these details is difficult to interpret.
GEDI also provides modeled biomass rather than a direct weighing of trees. Its lidar observations describe forest structure; biomass models translate those observations into aboveground biomass density. The L4A product supplies footprint-level predictions, prediction standard errors and prediction intervals.
This distinction matters when assessing a map trained on GEDI. Agreement with held-out GEDI footprints tests consistency with that reference product. It does not independently establish accuracy against field biomass, particularly where the two products share model assumptions.
A 2022 study in Remote Sensing of Environment developed a biomass-map assessment framework that explicitly accounts for uncertainty in plot-based biomass estimates. Disagreement between a map and a reference should not automatically be attributed entirely to the map.
Match Areas, Locations and Dates
Compare the Same Ground Area
A nominal GEDI footprint is approximately 25 metres across. It is not equivalent to a 25-metre square pixel, and neither necessarily matches a forest inventory plot.
For plot-to-map validation, use the actual plot boundary to calculate an area-weighted mean of map predictions. This is most defensible where the plot is large enough relative to the map’s effective resolution. A small plot cannot validate a much larger pixel simply because its centre falls inside it.
For plot-to-GEDI comparisons, assess footprint overlap. Assigning the biomass density of an entire one-hectare plot to every GEDI shot within it assumes that biomass is sufficiently uniform. Where mapped tree locations or suitable airborne lidar are available, they can help construct references closer to footprint scale. Any additional modeling uncertainty must remain visible.
Check Positioning Before Comparing Values
Review coordinate systems, plot surveying methods, satellite geolocation and raster alignment. Public inventory coordinates may be displaced for confidentiality and therefore unsuitable for direct pixel matching.
Location errors are especially consequential near clearings, roads and stand boundaries. Test plausible positional shifts based on documented location uncertainty and report how much the comparison changes. Do not move plots to whichever position produces the best agreement.
Match Observation Dates
Retain the field measurement date, GEDI acquisition date and imagery period used to produce the map. A product’s publication year may differ from the years represented by its observations.
Check intervening imagery for harvesting, fire, storms or land conversion. Use remeasurement or a documented growth model when a temporal adjustment is necessary, carrying its uncertainty forward. Simply excluding disturbed sites restricts the validation to stable forest and must be reported as such.
A Worked Validation Design
The following is an illustrative design for assessing an annual 30-metre biomass map across a project containing plantations and natural forest. It describes an assessment to perform, not a completed experiment or measured accuracy result.
- Define the claim. Assess map performance at plot scale and estimate project-wide mean density and total biomass separately. Set acceptable uncertainty according to the intended management use.
- Audit reference samples. Compile plot polygons, dates, biomass definitions, allometric methods, location accuracy and available uncertainty. Check whether any plots contributed to the map or its upstream calibration.
- Screen satellite references. Record the exact GEDI product version and acquisition dates. Apply that version’s documented quality criteria, inspect degraded observations and identify predictions outside the model’s calibration domain. Preserve uncertainty variables.
- Create matched records. Calculate plot-area map means, inspect footprint overlap and document date differences. Keep an exclusion log, including the number and forest types of samples removed.
- Separate development from testing. Reserve entire geographic blocks or inventory clusters for final evaluation. Keep model tuning and any bias correction within the development data.
- Evaluate the frozen model. Calculate errors overall and separately for plantations, natural forest, biomass ranges and terrain classes. Identify poorly represented conditions.
- Assess the project total. Use a suitable inventory sampling estimator, map-assisted estimator or explicit model-based approach. Calculate uncertainty for the project boundary rather than borrowing a plot-level error metric.
If only public data are available, first confirm that their dates, geometry, licensing and calibration history support the intended comparison. An airborne-lidar biomass map can provide a useful reference, but it remains a modeled product with its own uncertainty. If no independent reference is available, describe the exercise as product comparison rather than independent validation.
Use Spatially Independent Tests
A random split can place nearby plots, adjacent GEDI shots or observations from the same stand in both training and testing sets. Their shared conditions can make performance appear stronger than it will be in an unobserved location.
Choose validation blocks and separation distances according to spatial dependence and the intended application. A model intended for another region needs a stronger transfer test than one used to fill gaps within an existing survey.
Keep all observations from the same plot or reference cluster together. Spatial independence does not guarantee representativeness: the final sample must also cover the forest conditions for which an accuracy claim is made.
Report Bias, Error and Interval Performance
At minimum, report the number of independent validation units, mean bias, root mean square error and mean absolute error in Mg/ha. Define error consistently, for example as prediction minus reference, so positive bias means overestimation.
Show predicted versus reference values and residuals across biomass ranges. A single overall statistic can conceal overestimation in sparse forest and underestimation in dense stands. R² can supplement these results, but it does not measure bias or establish acceptable accuracy.
For prediction intervals, report both their width and empirical coverage. A nominal 90% interval should contain approximately 90% of comparable independent reference outcomes, with reference uncertainty considered in interpreting that comparison.
The spread among trees in a random forest is not automatically a calibrated prediction interval. Likewise, bootstrap resampling of individual neighboring shots can understate uncertainty. Resampling should reflect the relevant sampling units and spatial structure, and include the sources of uncertainty the interval is intended to represent.
Pixel Error Is Not Project-Total Uncertainty
A map-based biomass total is calculated by multiplying each biomass-density prediction by its represented area and summing across the boundary. The uncertainty of that total depends on how errors vary together across the landscape.
Some local errors may partly cancel. Shared model bias, allometric assumptions and spatially correlated errors may persist across large areas. Consequently, neither multiplying pixel RMSE by project area nor dividing it by the square root of the pixel count provides a generally valid uncertainty estimate.
Research on uncertainty from pixels to forest parcels illustrates why spatial correlation and multiple uncertainty sources matter when aggregating biomass predictions.
GEDI products demonstrate the distinction. L4A describes individual footprint predictions. The L4B Version 2 product estimates mean biomass density for 1-kilometre cells, with uncertainty associated with sampling and biomass modeling. Its mean covers forest and non-forest within the cell. Neither its resolution nor its standard error should be interpreted as a fine-scale project validation result.
Validate Change Separately
Subtracting two biomass maps produces a mapped difference. It does not by itself demonstrate a reliable change in carbon stock.
Compare biomass definitions, forest masks, spatial alignment, reference periods and processing methods first. A model-version change can create an apparent ecological change. Repeat plots and independent disturbance records help test whether the difference reflects actual growth, mortality or removal.
For comparable stock estimates, change uncertainty depends on both dates and their covariance: Var(change) = Var(stock₂) + Var(stock₁) − 2 × Cov(stock₁, stock₂). Assuming independence without justification can misrepresent uncertainty. Small estimated gains may remain unresolved even when each stock map appears useful.
Deliver Evidence Alongside the Map
A useful biomass delivery includes the reference-data register, matching rules, exclusions, spatial validation design, error summaries, uncertainty method and limitations by forest type. It should state which conclusions are supported: identifying broad patterns, estimating a regional total or detecting change are different claims.
STARPATH GLOBAL integrates satellite observations, data processing and analytical workflows for forest monitoring. For a biomass assessment, the starting point is to establish whether available reference data can test the required result. To discuss a validation-led monitoring workflow for your project, contact our team.
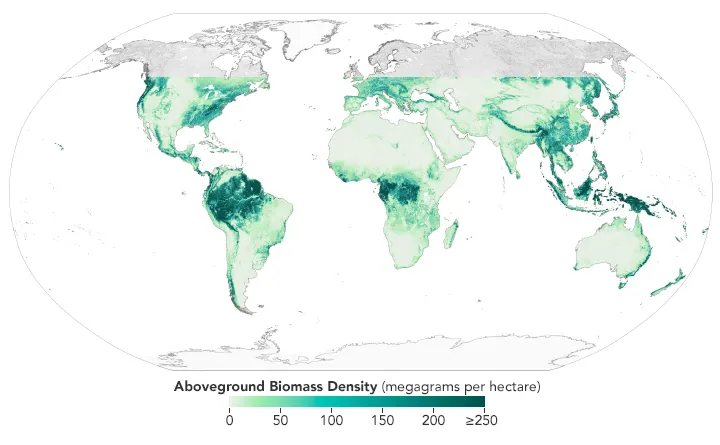
Top image: Biomass density across GEDI’s observation area. The GEDI lidar mission collected six million laser observations every day between 2019 and 2023. There are gaps in GEDI’s coverage—and the instrument does not collect data north of about 52° latitude—which is evident as white space in both maps.