Satellite soil moisture can help identify drying trends, track surface wetting and prioritize agricultural inspections. Whether it can support decisions for an individual field depends on what the product estimates, the area each estimate represents and how it performs against local measurements.
A map displayed at 30 metres does not necessarily contain independent 30-metre observations. A surface moisture estimate does not describe all the water available to crop roots. Before using either for irrigation, agricultural teams need to establish the connection between the satellite signal and the conditions they intend to manage.
Which Moisture Measurement Does the Field Need?
Several different quantities appear in agricultural monitoring products:
- Surface soil moisture: water content in a shallow layer near the soil surface. SMAP surface products represent approximately the upper 5 centimetres. The effective sensing depth of other microwave observations varies with wavelength and surface conditions.
- Root-zone soil moisture: water content across a deeper soil profile. Its relevance depends on crop rooting depth and soil conditions. Satellite-informed estimates generally require a model to connect surface observations with deeper water storage.
- Vegetation water content: water held in plant tissues, contributing to optical and microwave signals. It is related to crop condition but differs from water stored in the soil.
- Relative wetness: an index describing how wet or dry conditions are relative to a reference range or historical baseline. It may have no direct conversion to volumetric water content.
Volumetric soil moisture is commonly expressed in m³/m³. A value of 0.20 means that water occupies 20% of the represented soil volume. It does not mean that 20% of the crop’s available water remains. Estimating plant-available water also requires information about soil water retention and the relevant rooting depth.
These distinctions affect the decision. Surface wetting may be useful for investigating rainfall or irrigation events. Scheduling the next irrigation usually requires an assessment of water depletion across the active root zone.
What Sentinel-1, Optical Indices and SMAP Can Contribute
Sentinel-1: Detailed Surface Information with Retrieval Conditions
Sentinel-1 measures C-band radar backscatter. Soil water changes the soil’s dielectric properties, influencing the returning signal. This makes radar useful for estimating surface moisture, particularly where the soil contribution remains detectable.
Backscatter also responds to surface roughness, crop structure, vegetation water content and viewing geometry. Tillage can change the signal without a corresponding moisture change. As crops develop, scattering from stems and leaves can alter or obscure the soil response. Soil texture and related dielectric and hydraulic properties also affect retrieval and interpretation.
Consequently, there is no universal equation that turns every Sentinel-1 image into an accurate soil moisture map. A retrieval needs a defined method for handling vegetation, roughness and acquisition geometry, followed by validation under the intended conditions.
Radar speckle introduces another trade-off. Spatial averaging can improve stability, but it reduces the detail retained within small fields. The delivered pixel spacing should therefore be reported alongside the processing and effective analysis scale.
Optical Indices: Useful Context, but Check What They Represent
Optical observations can support moisture assessment through exposed-soil reflectance, vegetation indices and other modelling approaches. Their interpretation changes with soil exposure, crop cover, soil colour, residues and observation conditions.
The Normalized Difference Moisture Index, or NDMI, uses near-infrared and shortwave-infrared reflectance and is commonly used to characterize vegetation water content. Over a growing crop, a change can reflect canopy development as well as water-related conditions. It cannot be read directly as root-zone soil moisture.
The label “NDWI” also refers to different band combinations in the literature. Always check the formula and intended target before selecting an index. Our article on crop health monitoring explains why vegetation indicators require crop and field context.
SMAP: Regional Moisture Context
SMAP’s L-band radiometer supports surface soil moisture retrieval over broad areas. Its products are valuable for examining regional wetting, drying and drought anomalies, subject to quality screening.
Grid spacing and observation resolution require particular care. The enhanced passive SMAP product is posted on a 9-kilometre grid, while its nominal spatial resolution is approximately 33 kilometres. Adjacent grid cells therefore do not represent independent measurements of separate 9-kilometre areas.
A small irrigated field may occupy only a fraction of the contributing area. Its moisture changes can be diluted by surrounding rainfed fields, vegetation and other land cover. A regional drying signal provides useful context, but does not establish the condition of every field inside it.
Root-Zone Products Depend on Models
NASA’s SMAP Level-4 soil moisture system combines satellite brightness-temperature observations with a land surface model through data assimilation. Its root-zone variable represents the upper metre of soil, while surface moisture represents the upper 5 centimetres.
The model uses meteorological forcing and representations of soil-water processes to estimate how water enters, moves through and leaves the soil profile. Assimilating satellite observations helps constrain those estimates. SMAP does not directly observe water throughout the upper metre.
The product provides 3-hourly fields on a 9-kilometre grid. That output interval does not mean the satellite makes a new observation of each location every three hours. For field applications, users should also check whether model assumptions and forcing adequately represent local irrigation, soils and crop conditions.
Why Downscaling to 30 Metres Does Not Create 30-Metre Observations
Resampling a coarse product to smaller cells changes its representation. Downscaling goes further by using additional information, such as vegetation, temperature, terrain, soil properties or radar observations, to estimate finer spatial variation.
Downscaling can add useful information when those relationships hold. However, the fine-scale values remain estimates whose reliability depends on the inputs, training data and model assumptions.
Consider two neighbouring fields with similar crops and soils, only one of which was recently irrigated. If the inputs contain no observation that captures that difference, a downscaling model may fail to distinguish them despite producing a detailed map.
Validation against the original coarse product cannot, by itself, demonstrate accuracy within fields. Likewise, randomly splitting neighbouring pixels between training and testing can overstate performance when they share the same coarse reference value. Independent fields, periods or seasons should be withheld according to the intended deployment.
Match the Monitoring Goal to the Evidence
What a Published Field Study Demonstrates
A 2023 study in the International Journal of Applied Earth Observation and Geoinformation evaluated Sentinel-1 soil moisture against measurements collected at 20-metre spacing in a non-irrigated agricultural field of approximately 2.5 hectares in Luxembourg.
The researchers tested retrievals at spatial resolutions from 20 to 120 metres. At 60 metres and coarser, they reported a temporal correlation of 0.67 while retaining information about within-field variation. Spatial correlation was constrained by the limited moisture variability present within the field.
The study demonstrates potential for tracking temporal changes within agricultural fields. It also shows why the finest output grid is not automatically the most reliable choice. Its results do not establish a universal 60-metre threshold or demonstrate irrigation scheduling accuracy across other crops and soils.
How to Validate a Product for Your Fields
Match Depth, Location and Time
Compare a surface retrieval with appropriately shallow measurements, documenting the depth and soil volume represented by each sensor. Deeper probes remain valuable, but they answer a different question. For root-zone validation, use measurements distributed through the relevant profile rather than treating one deep probe as a complete reference.
Synchronize timestamps and time zones, and match ground readings to the satellite acquisition as closely as practical. Record rainfall and irrigation between the two measurements. A daily average may conceal a wetting event that occurred shortly before or after an overpass.
Use multiple sampling locations to represent important differences in soil, slope, crop cover and irrigation distribution. Check probe installation, calibration and quality flags. A single probe near a dripper or in an unusually wet depression may poorly represent the surrounding satellite pixel.
Separate Calibration from Independent Testing
Use one dataset to fit or adjust the retrieval, then evaluate it on withheld observations. A product intended for new fields should be tested on fields excluded from calibration. A product intended for future seasons should also be evaluated across independent periods and changing crop conditions.
Report bias, RMSE, unbiased RMSE and temporal correlation together with sample counts and data availability. Correlation measures whether estimates rise and fall together; it does not establish accurate absolute water content. Performance should also be examined separately for wet and dry conditions, crop stages and management events.
Inspect Agreement and Disagreement in the Time Series
A useful evaluation plot places satellite estimates, shallow probes, deeper probes, rainfall and irrigation records on the same timeline, with units and depths clearly labelled. Show satellite observations at their acquisition times and distinguish modelled or interpolated values.
Examine both matching responses and discrepancies. Surface moisture may rise after light rain while deeper sensors barely change. During subsequent drying, the surface can become dry while water remains available below. Such differences can reflect real soil processes rather than retrieval failure.
Also investigate unexplained satellite changes, particularly around tillage, harvest or rapid canopy development. Without local measurements, published validation can guide a pilot design, but it cannot establish accuracy for a specific farm.
When Is the Result Ready for Irrigation Decisions?
Regional products can provide drought context and help prioritize field visits. Locally validated surface retrievals can add information about wetting, drying and spatial differences. Using those observations to determine irrigation timing and amount requires a further connection to root-zone depletion, crop demand, soil water retention, expected weather and irrigation performance.
Operational usefulness also depends on observation gaps and delivery time. A reliable estimate delivered after the irrigation decision has been made has limited value for that decision. Before deployment, define acceptable errors, required update frequency and the conditions under which field measurements must take priority.
For agricultural monitoring projects, STARPATH GLOBAL can help assess imagery options and combine satellite observations with field boundaries, weather and local measurements. Explore our imagery catalog or discuss your requirements to plan a workflow suited to your fields and decisions.
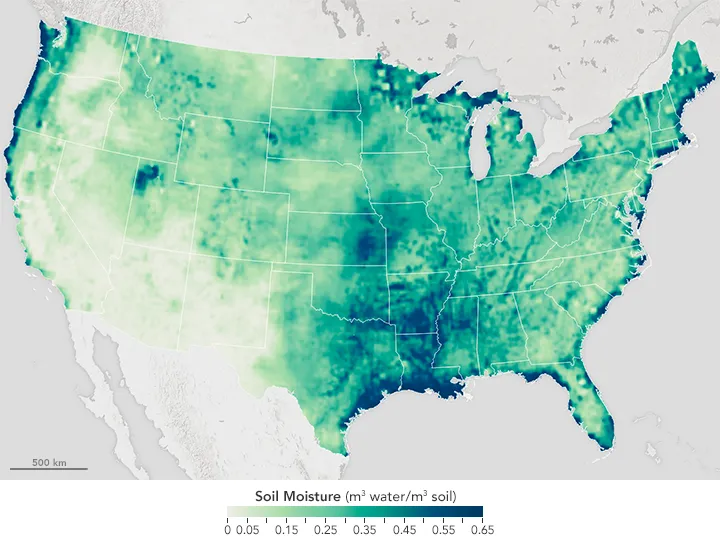
Top image: Soil Moisture in the United States (May 27-31, 2015)