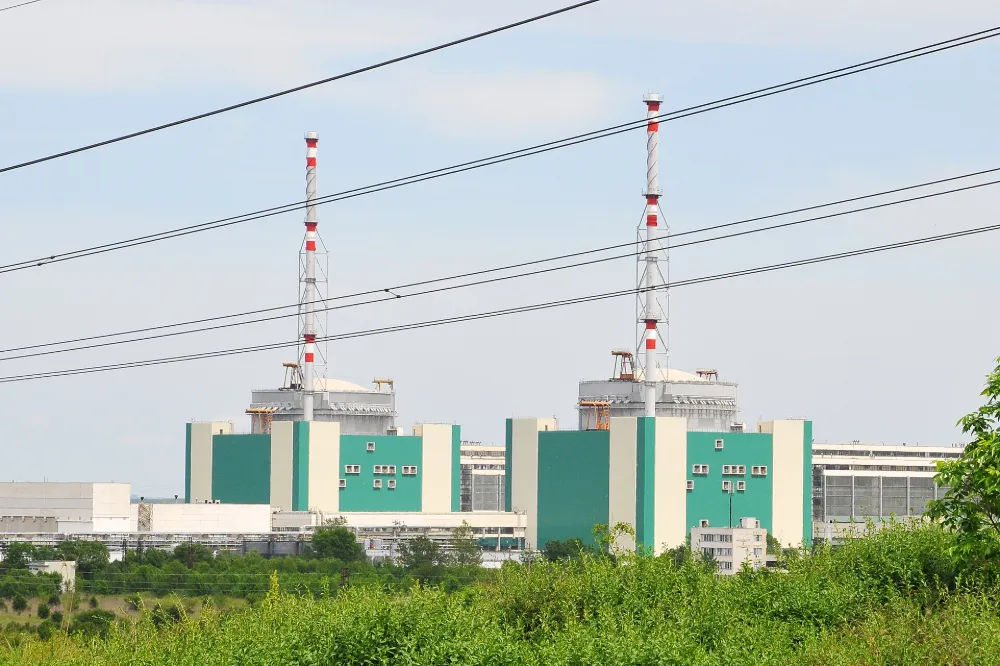
On 20 August 2026, Bulgaria’s Ministry of Energy and Kozloduy Nuclear Power Plant announced that Unit 5 would be reduced by approximately 120 MW on 21 August as a preventive measure in response to the Danube’s continuing decline to critically low levels. The reduction was equivalent to roughly 12% of the unit’s approximately 1,000 MW nominal capacity.

A drone view of a boat sailing near the exposed riverbed of the Danube River at record-low water levels, in Sandrovo, Bulgaria, August 13, 2026. REUTERS/Stoyan Nenov
According to Bulgaria’s Ministry of Energy, this was the first time in Kozloduy’s 52-year operating history that a unit had been reduced because of extreme meteorological and hydrological conditions. The plant currently operates two approximately 1,000 MW units and typically accounts for around one-third of Bulgaria’s electricity generation.
The event is significant because it forms part of a wider regional pattern in which hydrological conditions are constraining energy and transport infrastructure.
During July and August 2026, record or near-record low water levels were reported along several sections of the Danube. Romania’s Cernavodă nuclear units were taken offline in controlled shutdowns linked to declining river levels, while Hungary’s Paks nuclear plant substantially reduced generation. Low flows also affected energy production, navigation and irrigation in Romania, Serbia, Croatia and Hungary.
The 2026 Danube drought illustrates how water-resource conditions can become direct operational constraints for energy systems, inland transport and other critical infrastructure.
The operational question is therefore straightforward: how can infrastructure operators detect deteriorating water conditions early enough to assess which assets may be affected?
When Hydrological Change Becomes an Infrastructure Constraint
Rivers are not only part of the natural environment. They are also an essential external condition on which many infrastructure systems depend.
For nuclear power plants that use river water in their condenser and heat-rejection systems, changes in water level, discharge and temperature can affect operating conditions. At Kozloduy, Danube water is used to cool steam in condensers in the plant’s non-nuclear section; it is not used directly to cool the reactor core. For hydropower plants, river flow and reservoir storage directly determine the amount of energy available for generation. For inland shipping, declining water levels can restrict vessel draft and cargo capacity.
Similar dependencies exist in industrial water use, municipal water supply, and agricultural irrigation.
When high temperatures, insufficient precipitation, and declining water availability across a watershed occur at the same time, the effects may extend beyond the natural environment and propagate through infrastructure and supply chains:
High temperatures and low precipitation can increase evapotranspiration and reduce watershed water availability. Combined with upstream inflow, reservoir-management and water-demand conditions, this may lead to lower river levels and flows, creating constraints for water abstraction, condenser operation, hydropower generation and navigation.
Copernicus Climate Change Service data for July 2026 indicated drier-than-average conditions across much of western Europe and large parts of central Europe. EFAS data used in the bulletin showed much-below-average or exceptionally low monthly river flows across many affected regions.

Anomalies and extremes in monthly average river flow across Europe in July 2026. Much-below-average and exceptionally low flows affected large parts of western, central, and eastern Europe, including the Danube basin. Data: EFAS. Credit: CEMS/C3S/ECMWF.
Conditions along the Danube were particularly severe. Copernicus reported record or near-record low water levels along parts of the river, with documented effects on navigation, irrigation and energy production in Romania, Serbia, Croatia and Hungary.
The Kozloduy reduction was therefore not an isolated event. It was one documented instance of regional hydrological stress contributing to an operational constraint.
For power and utility operators, risk monitoring should therefore cover not only the operating condition of an asset itself, but also the environmental conditions on which that asset depends.
Operators Need to Know More Than “How Low Is the Water?”
A change in water level at a single gauging station is only the starting point for risk assessment.
Operators may need to answer four related questions:
- Where are water levels, river flows or surface-water extent deteriorating?
- Is the change a short-term fluctuation or part of a sustained watershed trend?
- Which assets depend on the affected river sections or reservoirs?
- Are gauge readings and forecasts approaching facility-specific operating or regulatory thresholds?
The difficulty is that water risk is spatial, time-dependent and often cross-regional.
Hydrological stations and field measurements can provide highly accurate observations, but inpidual monitoring locations are discrete. A major river may cross several countries and administrative regions, while energy and industrial assets may be distributed across a vast watershed.
Ground stations remain essential for measuring water level and discharge at specific locations. Earth observation can add a repeated, spatially consistent view of surface-water and land conditions across larger areas, helping operators place inpidual gauge readings in a wider watershed and asset context.
This is where satellite Earth observation can provide additional value.
From Monitoring River Change to Assessing Watershed Conditions
One of the most direct applications of satellite remote sensing is the repeated observation of surface water across large areas.
Optical satellite imagery can be used to identify changes in visible water-body boundaries, river width, exposed riverbeds and sandbars. Time-series imagery can reveal whether surface-water extent is contracting or recovering and where the most significant changes are occurring. Combined with gauge and hydrological data, this spatial perspective can support a more complete assessment of water conditions and their relevance to exposed assets.
Synthetic aperture radar can provide complementary observations through cloud cover and at night, reducing dependence on clear-sky imagery. However, vegetation, rough water surfaces, complex shorelines and spatial resolution can affect water-boundary detection.
The current changes along the Danube have already been directly documented through satellite observation.
On 7 August 2026, the European Space Agency published Copernicus Sentinel-2 images of a section of the Danube about 45 km north of Budapest, comparing 9 August 2025 with 4 August 2026. ESA reported noticeably lower water levels in the 2026 image, with more visible sandbanks and a substantially drier surrounding landscape.

Copernicus Sentinel-2 images of the same section of the Danube River, approximately 45 km north of Budapest, acquired on 9 August 2025 and 4 August 2026. Lower water levels, exposed sandbanks, and drier surrounding land are clearly visible in the 2026 image. Source:ESA.
ESA reported record-low Danube levels in Hungary and linked the low-water conditions to energy and water shortages around Budapest, as well as problems for river barges and ferries.
Such imagery can provide a direct answer to one question:
What has physically changed along the river?
But simply observing that “the river has narrowed” is not enough.
A river is only one part of a wider watershed system. Determining whether low water levels represent a short-term fluctuation or a broader and more persistent water-resource pressure requires additional analysis of precipitation, soil moisture, temperature, and other environmental variables.
According to Copernicus, monthly average surface-soil moisture reached the lowest July levels in the ERA5-Land record since at least 1979 across many parts of western and central Europe. River flows across large areas were also substantially below average.

Combined Drought Indicator for Europe in late July 2026, integrating precipitation, soil-moisture, and vegetation conditions. Alert conditions affected parts of the Danube basin, including Hungary, Austria, Serbia, and Romania.Source: EU Drought Observatory, Copernicus Emergency Management Service
The monitoring logic can therefore evolve from:
“What is happening to this river?”
to:
“How are water-resource conditions changing across the entire watershed?”
From Environmental Change to Asset Exposure
Even a clear understanding of watershed conditions does not directly answer infrastructure operating questions.
To transform environmental monitoring into risk information, hydrological changes must be connected with the locations and functions of specific assets, as well as their dependence on water resources.
A more complete analytical framework can include three levels.
-
Identify Changes in Water Bodies and River Channels
Satellite time series can be used to map observable changes in rivers, reservoirs and other surface-water bodies and to compare the timing and persistence of those changes against a historical baseline.
-
Assess Watershed Environmental Conditions
Precipitation observations, modelled or reanalysis-based soil-moisture indicators, temperature records, gauge data and hydrological forecasts can help determine whether an observed low-water condition is local and temporary or part of broader watershed stress.
-
Identify Exposed Assets
Environmental data can be combined with asset locations, water-intake and discharge points, relevant river reaches and known water dependencies. This supports initial exposure screening; determining operational risk requires additional facility, hydrological and engineering data.
The question is then no longer simply:
How much has the surface-water area of a particular river section decreased?
Instead, it becomes:
Which critical assets are exposed to these changes, and are conditions approaching levels that could constrain operations?
This is the point at which environmental monitoring begins to develop into infrastructure risk analysis.
Why Multiple Data Sources Are Needed
Water–energy risk can rarely be fully described by a single data source.
Different types of data serve different purposes:
Optical satellite imagery Identifies changes in water-body boundaries, river width, exposed riverbeds, and land cover.
Synthetic aperture radar imagery Provides complementary observations of water bodies and surface changes under cloud cover or at night.
Meteorological and environmental data Provides information on precipitation, temperature, soil moisture, and regional drought conditions.
Hydrological station data
Provides location-specific measurements of water level and, where available, river discharge. Discharge may be derived from a site-specific rating curve rather than measured directly.
Infrastructure and operational data Provides information on asset locations, water-withdrawal requirements, equipment status, and actual power output.
Hydrological and meteorological models Assess how water-resource pressures may persist or develop in the future.
These data sources do not replace one another. Satellites are suited to providing repeated, wide-area and spatially consistent observations. Hydrological stations provide location-specific water-level measurements and, where available, river-discharge estimates or measurements. Facility systems hold information about water demand, equipment status and actual power output.
Only by combining these sources can operators assess whether environmental changes are approaching conditions that could affect operations.
This creates a more complete risk-assessment chain:
Environmental observation → Hydrological assessment → Asset-dependency mapping → Calibration against gauge and operational data → Risk screening and early-warning support → Operational decision support
Within this process, satellites are not intended to replace hydrological stations or infrastructure operating systems. Instead, they add a repeated, wide-area and spatially consistent layer of environmental observation.
Depending on the monitoring area, observation period, and environmental conditions, different types of satellite imagery and Earth observation data can be combined.
From Event Response to Earlier Risk Identification
Current conditions along the Danube demonstrate that environmental conditions have become an operational variable that energy infrastructure cannot ignore.
In the past, organisations often acted only after risks had already begun to affect assets—when generation declined, transportation was restricted, or water supply came under pressure.
When extreme hydrological events may repeatedly affect infrastructure operations, responding only after impacts occur may no longer be sufficient.
A more resilient approach is to regularly integrate satellite observations, gauge measurements, forecasts and asset information, moving risk management progressively upstream—from post-event response to trend identification, asset screening and earlier review.
For example, repeated satellite observations may show declining surface-water extent while upstream gauges indicate lower inflows and forecasts suggest little near-term recovery. When these indicators are evaluated against an asset’s known water dependency and operating thresholds, they can help identify facilities requiring closer review. Operators may then prioritise field verification, increase monitoring frequency or initiate an engineering and operational assessment.
This approach does not provide a deterministic prediction of plant operations, nor does it replace gauge networks, on-site measurements or engineering judgement. Its value is to support earlier and more consistent review of emerging environmental conditions.
From Monitoring Capability to Business Validation
The Danube case shows that hydrological conditions have become an external variable that energy and infrastructure operators cannot afford to overlook.
For operators, however, simply obtaining more satellite imagery does not solve the problem. They must determine:
- Which types of environmental change are most relevant to their assets?
- Can existing satellite and environmental data reliably identify those changes?
- Can the data be integrated with existing asset and operating systems?
- Can the resulting analysis support real operational decisions?
A more practical starting point is therefore not to decide which data product to purchase, but to select a specific risk problem and test whether satellite-based monitoring can address it.
STARPATH GLOBAL’s FDE service is designed around specific business scenarios. It evaluates the suitability of satellite remote sensing, designs the required data and analytical workflow, and validates its business value through practical use cases.
The results can help customers determine whether a scenario is suitable for continuous deployment, what monitoring frequency is required, and how the solution can be integrated into existing risk-management processes.
Power, utility, and infrastructure operators facing low water levels, drought, extreme heat, or other environmental risks can begin with a specific geographic area, a defined group of critical assets, or a particular operational constraint. From there, they can work with STARPATH GLOBAL to evaluate an appropriate data and analytical approach.
Infrastructure resilience requires not only an understanding of what is happening to the assets themselves, but also earlier visibility into how the environmental systems on which those assets depend are changing.