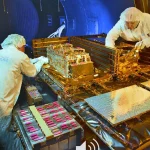
A satellite is often treated as an exceptionally delicate object on the ground: temperature and humidity are tightly controlled in cleanrooms, lifting speeds are limited, connectors are fitted with protective caps, and optical surfaces cannot be exposed casually. But once sealed inside a payload fairing, it must endure engine ignition, liftoff, transonic flight, maximum dynamic pressure, engine shutdown, stage separation, fairing separation and spacecraft separation—all within a matter of minutes.
How brutal is this journey?
The most obvious answer is that the satellite must withstand “many g’s.” Yet that is also one of the most misleading ways to describe the launch environment. An axial acceleration sustained for several seconds, broadband random vibration lasting tens of seconds, an intense acoustic field arriving from all directions, and a high-frequency shock lasting only a few milliseconds are described using different environmental metrics. Although all of them may produce measurable acceleration responses, they are not the same type of load, and their peak values cannot be directly ranked against one another.
The real engineering problem has five layers: What flight event generates the environment? Through what path does that environment enter the satellite? How do the structure and equipment respond? What failures could jeopardize the mission? What evidence can ground testing provide to demonstrate that the satellite will survive? Only by linking these five layers can we understand what vibration shakers, acoustic chambers, shock-test systems and thermal-vacuum chambers are actually testing.
Satellites do not survive launch simply by being built “thicker and stronger.” They survive through well-defined load paths, appropriate stiffness and damping, reliable hold-down and venting designs, and a closed verification loop combining analysis, testing at multiple product levels and flight data.
Table 1: Typical launch events and the sequence of associated environments. The specific sequence of events and controlling environments varies by launch vehicle and mission. Source: Author’s analysis based on publicly available information.
1. Do Not Ask Which Moment Is the Worst—Ask What Each Part Is Most Vulnerable To
At ignition, engine thrust builds up, while exhaust plumes and reflections from the launch pad generate intense noise. The launch vehicle structure also transmits low-frequency transients and structural vibration to the satellite through the payload adapter. After liftoff, the rocket continues accelerating, producing inertial forces in every piece of equipment, propellant and structure inside the satellite. Upper-level winds, engine gimballing and attitude corrections also generate lateral loads.
As the vehicle passes through the transonic regime and approaches maximum dynamic pressure, the external airflow imposes substantial aerodynamic loads on the rocket. However, maximum dynamic pressure is not synonymous with “maximum pressure on the satellite.” It is the phase of flight when freestream dynamic pressure reaches its peak, and aerodynamic loads and pressure fluctuations on the launch vehicle often deserve particular attention. The satellite remains inside the fairing and experiences this phase primarily through the launch vehicle structure, the fairing and the internal acoustic field.
Engine shutdown, stage separation, fairing separation and spacecraft separation then occur in succession. These rapid release events can generate mechanical shock.
It is important to recognize that the fairing is already venting continuously during ascent. Gas inside the fairing and trapped within the satellite is discharged through designated vent paths. The satellite does not remain at sea-level pressure until fairing separation and then suddenly enter a vacuum.
Fairing separation instead changes the satellite’s exposure boundary. It transitions from a protected, low-pressure environment inside the fairing to direct exposure to near-vacuum and the external radiation environment created by the Sun, Earth and deep space. Acoustic excitation inside the fairing also decreases substantially.
The primary load-bearing structure may therefore be most sensitive to quasi-static loads and low-frequency bending. Large solar-array panels or antennas may be more vulnerable to acoustic pressure. Crystal oscillators, relays and solder joints inside electronic units may be more sensitive to localized high-frequency shock. Thermal-control films and enclosed covers may also be vulnerable to differential pressure during venting.
There is no single “worst moment” for the entire satellite—only controlling load cases for different components.
2. G-Loads: Apparently Simple, but Really a Test of How the Entire Satellite Carries Loads
The basic relationship remains F = ma. As the rocket accelerates, the satellite’s equipment, propellant and structure develop inertial forces. Greater mass produces greater inertial force. The farther a piece of equipment is located from the primary load-bearing plane, the more important the bending moment on its bracket and the main structure may become.
Axial loads are primarily associated with thrust, drag and propellant consumption. Lateral loads are often associated with winds, engine gimballing, attitude control and short-duration transients.
The term “quasi-static load” in engineering documentation does not mean the flight is genuinely smooth or nearly static. It combines steady acceleration and some low-frequency dynamic effects into equivalent axial and lateral acceleration combinations that can be used for structural design and verification.
Neither the satellite nor the launch vehicle is a rigid body. Mass, center of gravity, natural frequencies, damping and interface stiffness all interact. Mission-specific loads must therefore normally be determined through coupled loads analysis between the launch vehicle and spacecraft.
This explains why the load conditions cannot simply be copied when a different satellite is placed on the same rocket. If mass and lateral inertial load remain approximately unchanged, a higher spacecraft center of gravity relative to the launch-vehicle interface will generally produce a greater interface bending moment. Configuration changes also alter natural frequencies and mode shapes.
Propellant loading changes the spacecraft’s mass properties and modes. A large deployable antenna changes the local mass distribution even while locked in its launch configuration.
For example, the Falcon User’s Guide, Version 8, published by SpaceX in March 2025, divides its published quasi-static load envelope into payload-mass categories. The guide also makes clear that actual loads, accelerations and deflections depend on the structural dynamics of both the launch vehicle and payload and must be determined through mission-specific coupled analysis.[5] These are Falcon interface conditions from a commercial user guide, not universal figures for all rockets.
What Does the Ground Test Simulate?
The primary structure can undergo static loading, using actuators, tension straps or load fixtures to apply forces and moments at critical interfaces. Smaller products may be tested in a centrifuge to generate approximately constant acceleration. Required inertial loads may also be produced through sine-burst or low-frequency sinusoidal testing.
The test article should reproduce the flight hardware’s mass, center of gravity and mounting boundary conditions as closely as possible. Otherwise, the same acceleration expressed in g may correspond to entirely different interface forces.
Overload testing primarily answers whether the main load path, interfaces and mounting structures can withstand low-frequency inertial loads. It does not automatically cover acoustic pressure acting on thin panels, high-frequency random vibration or millisecond-scale separation shock.
3. Sine and Random Vibration: One Sweeps Through Frequencies, the Other Excites a Spectrum Simultaneously
Table 2: Evaluation metrics and principal verification objectives for five types of launch environment. The frequency and time ranges shown represent typical engineering scales. Source: Author’s analysis based on publicly available information.
Sine Vibration: Sweeping a Single Tone Through the Structure
At any given moment, a sine-vibration test primarily applies one frequency and then sweeps from low to high frequencies at a specified rate. When the excitation frequency approaches a structural natural frequency, even a modest base input can produce a greatly amplified local response.
NASA engineering material describes typical sine vibration as a simulation of the low-frequency launch environment at approximately 5–100 Hz and notes that test inputs may be derived from flight data or coupled loads analysis.[4] This is a typical range given in publicly available material, not a fixed range for every program. China’s current applicable standard is GB/T 34516-2017, Vibration Test Methods for Spacecraft.[8]
A low-level modal survey is intended to characterize the structure. It measures natural frequencies, damping, mode shapes and transfer functions so that the finite-element model can be updated. Higher-level sine testing verifies low-frequency flight responses, structural integrity and the condition of hold-down mechanisms.
The same shaker may be used in each case, but modal surveys, sine qualification tests and workmanship screening must not be treated as equivalent simply because the test setups look similar.
Random Vibration: Not Random Shaking, but a Controlled Statistical Process
A real rocket does not vibrate at a single rhythm. Engines, structures, aerodynamic noise and control actions combine many frequencies into a broadband random process.
Engineers use power spectral density, or PSD, to describe how energy is distributed across frequency, commonly in units of g²/Hz. Integrating the PSD over the target frequency band and taking the square root produces the overall root-mean-square acceleration, expressed as Grms.
Grms is only a summary of the total level, not a complete description of the environment. Two spectra may have the same Grms, but one may concentrate energy near a satellite resonance while the other avoids it, producing very different local responses. Engineers must also consider spectral shape, frequency range, duration, statistical basis, test direction, and the locations of control and response sensors.
Random vibration is particularly effective at revealing workmanship problems because its controlled broadband input repeatedly excites multiple local modes over a specified duration. This causes relative movement and alternating stresses to accumulate at connections and supports.
Inadequate fastener locking, poorly secured cable clamps, overly flexible circuit-board supports, intermittent connectors, weak solder joints and insufficient restraint of heavy components can all reveal themselves through resonance, friction and repeated bending.
The mechanism is not merely a matter of cycle count. It also depends on whether the spectrum covers sensitive modes, the response amplitude and the test duration. NASA’s General Environmental Verification Standard uses component-level random vibration both for environmental verification and for detecting workmanship defects.[3]
One bounded public example appears in the Falcon User’s Guide, Version 8. At the top of the payload adapter, the guide specifies a maximum predicted random-vibration environment envelope of 5.13 Grms from 20 to 2,000 Hz. It associates 20–100 Hz with whole-vehicle motion and modes, 100–600 Hz with aeroacoustic excitation, and 600–2,000 Hz with structural transmission.[5]
These figures apply only to the specified interface, statistical basis and guide version. They cannot be used directly as acceptance criteria for another rocket or another mounting location.
Why Can a Shaker Test Be More Severe Than Flight?
A shaker inputs motion from the base, but the test article may amplify its response at a structural mode. If the control system focuses only on forcing the interface spectrum to follow the target profile exactly, it may inject unrealistic energy into a large, flexible satellite at resonance.
Engineering practice may therefore use notching, response limiting or force-limited vibration. These limits must be derived from flight loads, interface forces or correlated analytical models. They cannot be improvised merely because a measured response appears high.
4. Vibroacoustics: Not Simply “Too Loud,” but Pressure Waves Acting on Structures
Table 3: Structural transmission and airborne acoustic excitation paths. Both ultimately produce responses in the satellite’s structure and equipment. Source: Author’s analysis based on publicly available information.
Engine exhaust, reflections from the launch pad and high-speed airflow create an intense acoustic field. Sound waves are rapid fluctuations in gas pressure. Although the fairing attenuates the external acoustic field, it is not a perfectly soundproof enclosure.
More precisely, external fluctuating pressure first excites the fairing structure and transmits sound into the enclosed volume. Acoustic blankets installed on the fairing’s inner surface absorb and attenuate parts of the spectrum. The remaining internal acoustic field then loads the satellite’s surfaces from multiple directions. The acoustic blanket is a control measure within the propagation path, not an active source of transmitted sound.
The difference from shaker-based excitation lies in the transmission path. A shaker primarily introduces motion through the spacecraft-to-launch-vehicle interface, whereas the acoustic field acts directly on exposed surfaces.
The instantaneous force on a panel can be approximated as pressure multiplied by area. Large, lightweight surfaces—including solar-array substrates, antenna reflectors, optical baffles and thin spacecraft panels—are therefore particularly sensitive. The panels then transmit their response to internal equipment, causing acoustic excitation and structurally transmitted random vibration to converge inside the satellite.
NASA-STD-7001C addresses both environments within a common vibroacoustic framework.[1]
Decibels are logarithmic and cannot be added like ordinary numbers. A 20 dB increase in sound-pressure level corresponds to an approximately tenfold increase in pressure amplitude. A 3 dB increase approximately doubles the mean-square sound pressure.
The Falcon guide provides another public example. Under specified conditions that include the standard fairing, acoustic blankets and 60% payload fill, the overall sound-pressure level is approximately 131 dB. The published prediction without acoustic blankets is approximately 138 dB.[5] These are predicted environments for specified configurations in a commercial guide and demonstrate the importance of acoustic blankets and spectral conditions.
How Is Such an Acoustic Field Reproduced on the Ground?
The traditional method places the spacecraft in a reverberant acoustic chamber, where gas-driven acoustic generators create a diffuse sound field. Multiple microphones control the spectrum in one-third-octave bands.
Another method is direct-field acoustic testing, in which arrays of loudspeakers are positioned around the test article. NASA-HDBK-7010 specifically discusses the applicability and limitations of direct-field testing.[11]
China’s GB/T 47271-2026, Acoustic Testing Method for Spacecraft, entered into force on July 1, 2026, and is identical to ISO 19924:2017.[7] The standard provides a methodological framework. Individual programs must still establish test conditions based on the mission acoustic spectrum, spatial distribution, duration and product configuration.
An acoustic chamber primarily reproduces the pressure-wave environment inside the fairing. It does not completely reproduce structural motion entering through the spacecraft-to-launch-vehicle interface. Whether a program conducts spacecraft-level acoustic testing, spacecraft-level random vibration or a layered combination therefore depends on product mass, surface area, architecture and responses at critical locations.
5. Shock: The Shortest Environment—and the One With the Most Frightening Numbers
Stage separation, fairing separation, hold-down release and spacecraft separation can all generate mechanical shock. Pyrotechnic devices release energy extremely rapidly, creating shocks with high peaks, high-frequency content and short durations.
The disturbance originates from separation nuts, explosive bolts, cutters, clamp bands or similar devices and then propagates through panels, beams, joints and interfaces. Distance, connections and material properties rapidly attenuate high-frequency components, while local modes may amplify the response at particular locations.
The most common tool for describing shock is the shock response spectrum, or SRS.
Imagine a row of small oscillators with the same damping but different natural frequencies. The same shock time history is applied to all of them. The maximum response of each oscillator is recorded and plotted against frequency.
The damping assumption must be stated. The quality factor Q and critical damping ratio ζ are related by Q = 1/(2ζ). For example, Q = 10 corresponds to ζ = 0.05. A higher Q represents lower damping and generally produces a higher calculated response near resonance. SRS results calculated using different Q values, conventions, measurement locations or directions cannot be compared solely by asking how many g they reached.
An SRS is not the original time history, nor does it mean that the entire satellite continuously accelerates at the peak value shown on the curve.
The appendix to NASA’s General Environmental Verification Standard describes pyroshock as a high-intensity, high-frequency, extremely short-duration traveling-wave response. It uses Q = 10 as an example definition and explains that high-frequency responses near the source rapidly attenuate as they propagate through structures and joints.[3]
Table 4: Quasi-static g, Grms and SRS peaks cannot be compared directly. The values shown illustrate engineering scales only. Source: Author’s analysis based on publicly available information.
The Falcon guide offers an intuitive example. Table 5-9 of the Falcon User’s Guide, Version 8, provides the average SRS at the spacecraft separation plane for 937 mm, 1,194 mm and 1,666 mm clamp-band separation systems. It specifies 1,000 g over the 1,000–10,000 Hz range.[5]
The guide also notes that shock characteristics may vary among separation systems and that the actual environment at the top of a mission-specific adapter must be calculated after the adapter and separation system have been selected.
The published table does not provide a detailed Q definition immediately alongside the values. Its 1,000 g figure should therefore be used only to illustrate the relevant units and scale, not for quantitative comparison with an SRS based on another Q value or measurement point.
There is no contradiction between this figure and the quasi-static envelope of several to slightly more than 10 g in the same guide. The first represents the maximum response of high-frequency oscillators to a millisecond-scale shock, while the second represents low-frequency inertial loading.
Why Do Ground Tests Prefer to Preserve the Actual Source and Propagation Path?
Shock is more difficult to reproduce than steady acceleration. The most representative method uses the actual or a highly representative separation device, structure and mounting interface so that the shock source and propagation path closely match the flight configuration.
Mechanical shock machines, pendulums, pneumatic impactors and other simulators may also synthesize a target SRS. The challenge is to cover the target spectrum without overtesting in irrelevant frequency ranges. Programs must also manage the poor repeatability of pyrotechnic events, their cost and the difficulty of recreating the state of single-use hardware.
Visual, functional and performance inspections must be conducted before and after testing. Critical equipment may be powered and monitored during the shock event.
Meeting the requirement at the control point only demonstrates that the specified input was achieved. Response-point exceedances, fixture resonance, sensor saturation and interruptions to product operation must each be evaluated separately.
6. Pressure, Vacuum and Temperature: The Environmental Rules Change With Altitude
A payload fairing is not a sealed pressure vessel. As the rocket ascends, external atmospheric pressure falls rapidly. Gas inside the fairing and satellite must escape through vents, gaps and dedicated channels.
If thermal-blanket cavities, contamination covers, honeycomb panels or equipment enclosures vent too slowly, the resulting differential pressure can inflate films, deform covers or turn protective hardware into a load source.
On the ground, pressure-profile or rapid-decompression testing can reproduce the mission pressure-versus-time curve. Engineers measure differential pressure, deformation and venting capability.
This testing simulates the depressurization rate and venting boundary conditions, not the complete orbital thermal environment. Venting analysis must also balance volume, effective vent area, flow resistance, contamination control and thermal requirements.
During ascent, convective heat transfer inside the fairing has already weakened as gas density decreases. After fairing separation, the satellite transitions from a low-pressure environment inside the fairing to direct exposure to near-vacuum and external radiation. It does not “instantly freeze to hundreds of degrees below zero.”
Equipment heat dissipation, radiation from the Sun and Earth, structural conduction and radiation toward deep space subsequently become the primary thermal boundaries. Different surfaces, attitudes and operating modes can produce entirely different temperature histories.
What Does Thermal-Vacuum Testing Actually Simulate?
A thermal-vacuum chamber uses low pressure, a cold thermal shroud and heating systems to establish hot and cold boundaries. The satellite is powered on, switched between operating modes and functionally checked during temperature plateaus and transitions.
The test verifies the thermal design and the spacecraft’s ability to operate in vacuum. Thermal cycling can also reveal problems involving materials, solder joints, connectors and assembly workmanship. NASA thermal-vacuum facility documentation and China’s current GB/T 34522-2017 both address the space vacuum-thermal environment and product verification.[9][12]
Two environmental regimes must therefore be distinguished clearly.
Launch depressurization concerns the pressure-versus-time profile inside the fairing, vent paths and transient pressure differentials. On-orbit thermal-vacuum conditions concern temperature boundaries, thermal balance, equipment operation and workmanship reliability in near-vacuum.
Thermal-vacuum testing is related to the post-launch environmental transition, but it cannot simply be described as reproducing the few minutes of launch. Rapid decompression, mechanical testing, thermal-balance testing and thermal-vacuum testing address different problems.
An intermittent electrical contact that remains hidden after vibration testing may also reveal itself during subsequent temperature cycling.
7. Ground Testing Is Not About Torturing the Satellite Repeatedly—It Is About Building Evidence
Table 5: Environments and boundary conditions covered by typical ground tests. Actual programs follow their approved verification matrices. Source: Author’s analysis based on publicly available information.
A program first uses launch-vehicle interface conditions, flight measurements, analytical models and heritage data to establish the maximum predicted environment. It then determines whether each product level will be verified through testing, analysis, inspection, similarity or a combination of methods.
Spacecraft-level testing is well suited to verifying overall interfaces and coupled responses. Subsystem testing addresses critical paths, while unit-level testing is more appropriate for high-frequency environments and workmanship screening.
NASA-STD-7002B, ECSS-E-ST-10-03C Rev.1 and China’s GB/T 42863-2023 all emphasize test planning, product levels and program-specific tailoring.[2][6][10]
This leads to a counterintuitive conclusion: subjecting the complete spacecraft to every possible test is not necessarily safer.
When a large, flexible satellite is mounted on a shaker, its boundary conditions differ from those in actual flight. Random-vibration input can therefore produce unrealistic overtesting. Some missions use spacecraft-level acoustic testing for large-area structures and supplement it with equipment-level random vibration to cover high-frequency environments and workmanship screening.
The Falcon user guide even requires customers to compare the responses produced by acoustic and random-vibration environments at critical locations before selecting a spacecraft-level test strategy.[5] This remains a public example of the Falcon mission-interface methodology, not a universal prescription independent of mission requirements.
What Do Qualification, Acceptance and Protoflight Testing Each Demonstrate?
Qualification testing primarily demonstrates that the design and manufacturing process provide adequate margin. It normally uses a dedicated qualification article or a specified representative configuration.
Acceptance testing is performed on each flight product and focuses more heavily on manufacturing quality and consistency between units.
A protoflight strategy subjects flight hardware to an environment that includes specified margin, reducing the need for a separate qualification article. However, the program must balance the number of tests, consumption of hardware life and the handling of anomalies.
Terminology, factors and durations vary among organizations. There is no universal set of elevated test levels that can simply be copied from a single standard.
Testing is not automatically better when it is more severe. Combining ignition, maximum dynamic pressure, separation shock, and the coldest and hottest boundaries into a single condition that could never occur in reality may damage the only flight article without adding meaningful mission evidence.
Justifiable conservatism must come from traceable statistical envelopes, test margins, measurement uncertainty and failure mechanisms—not arbitrary decisions made during testing.
8. How Does a Satellite Survive the Launch Phase?
First, the load path must be continuous. The spacecraft platform, central load-bearing cylinder or structural frame transfers axial force, shear and bending moment to the spacecraft-to-launch-vehicle interface. The design must avoid indirect load paths and abrupt changes in local stiffness. Structural design must also manage the first natural frequency to reduce the risk of adverse coupling with major launch-vehicle modes.
Second, local high-frequency vulnerabilities must be controlled. Circuit boards need appropriate support, heavy components require reinforcement, connectors and fasteners need locking features, and cable harnesses need enough freedom to accommodate movement without being allowed to whip around. Pipe spans must be controlled with clamps.
Isolators and damping treatments can reduce some responses, but they also introduce new modes and displacement requirements. Their design cannot be judged solely by whether they “reduce vibration.”
Third, anything that must remain locked should be locked, and anything that must vent should remain open. Solar arrays, antennas and robotic arms are secured during launch by hold-down and release mechanisms and deployed only after reaching orbit. Thermal blankets, contamination covers and equipment enclosures require reliable vent paths.
If a hold-down point is too flexible, the hardware may move excessively. If it is too rigid, it may transmit more high-frequency energy. If a vent is too small, differential pressure may accumulate. If it is too large, it may create contamination, thermal-control or electromagnetic problems. These are system-level trade-offs.
Fourth, models must be converted into measurement-based evidence. Accelerometers, strain gauges, microphones, force transducers, and temperature and pressure sensors record both inputs and responses.
Engineers do more than check whether anything broke. They compare natural frequencies, damping, functions, performance and interface conditions before and after testing. Test data are used to update structural and thermal models, while flight telemetry feeds back into the environmental envelope for future missions.
Conclusion: A Satellite’s “Suffering” Is Really a Precisely Maintained Ledger
Launch is unquestionably harsh, but its severity cannot be summarized by saying that the satellite is “shaken violently.”
The environment can be divided into low-frequency inertial loads, sinusoidal transients, broadband random vibration, acoustic pressure, mechanical shock, pressure profiles and vacuum-thermal boundaries. Each has its own source, propagation path, frequency scale, evaluation metric, vulnerable hardware and verification method.
Engineers do not try to make a satellite infinitely rigid. They determine where it should be stiff, where it should remain flexible, which paths must carry loads, which frequency ranges must be avoided, which risks should be verified at spacecraft level and which are better addressed through unit testing.
The final declaration that a satellite is “ready for launch” is not based on the applause that follows the shutdown of a vibration shaker. It is a conclusion jointly supported by predictions, testing, model correlation, anomaly closure and flight data.
The next time you see a satellite lifted onto a shaker, moved into an acoustic chamber or placed inside a thermal-vacuum facility, ask three questions: Which flight event is this test simulating? Through what path does the environment reach the satellite? Which failure mode is being evaluated?
If those three questions can be answered clearly, you have begun to understand spacecraft environmental testing.
References
[1] NASA-STD-7001C, Payload Vibroacoustic Test Criteria, July 14, 2026 (current).
[2] NASA-STD-7002B with Change 1, Payload Test Requirements, revalidated March 24, 2023.
[3] GSFC-STD-7000B, General Environmental Verification Standard (GEVS), 2021.
[4] NASA Engineering and Safety Center, The NESC Publishes Best Practices for Use of Sine Vibration Testing, 2016.
[5] SpaceX, Falcon User’s Guide, Version 8, March 2025. This is a commercial user guide; the article refers only to examples for its specified configurations and interfaces.
[6] ECSS-E-ST-10-03C Rev.1, Space Engineering — Testing, 2022.
[7] GB/T 47271-2026, Acoustic Testing Method for Spacecraft, effective July 1, 2026; identical to ISO 19924:2017.
[8] GB/T 34516-2017, Vibration Test Methods for Spacecraft (current as of August 24, 2026).
[9] GB/T 34522-2017, Thermal Vacuum Test Methods for Spacecraft (current as of August 24, 2026).
[10] GB/T 42863-2023, General Test Methods for Spacecraft.
[11] NASA-HDBK-7010, Direct Field Acoustic Testing (DFAT), 2016 (current handbook).
[12] NASA Johnson Space Center, thermal-vacuum facility reference page, verified August 24, 2026.