Satellite imagery can help identify some oil spills on land, particularly where contamination is exposed, sufficiently extensive, and observable in suitable spectral bands. It can also reveal surface changes that warrant investigation. But a dark patch near an oil well, an unusual soil color, or declining vegetation does not by itself confirm petroleum contamination.
For oilfield and pipeline operators, the practical question is whether imagery can provide reliable evidence for a particular site and decision. Detecting exposed hydrocarbons, identifying possible environmental impacts, and investigating a buried leak require different approaches.
Four Situations, Four Different Detection Problems
The term “oil spill detection” covers several physically different situations. A method that works on open water may offer little useful evidence for contaminated soil or a leak beneath vegetation.
Why a SAR Dark Patch on Land Is Not Proof of Oil
Synthetic aperture radar, or SAR, measures microwave energy scattered back toward the sensor. Over water, oil can suppress small wind-generated waves, reducing the radar return and creating a dark patch against a rougher surrounding surface. This is the physical basis of many marine oil-slick detection methods.
On land, radar brightness responds to a different combination of conditions: surface roughness, moisture, vegetation, terrain, wavelength, polarization, and viewing geometry. Smooth ground, calm water, and radar shadow can all appear dark. A low-backscatter area beside an oil well could therefore reflect the surrounding terrain or surface conditions rather than contamination.
Even on water, a dark feature is initially a candidate requiring interpretation. Transferring a marine dark-patch threshold or a model trained on ocean slicks to an oilfield does not establish a valid land-contamination detector.
Cropping a SAR image to a smaller area can make inspection easier, but it adds no spatial detail or chemical specificity. Analysts should retain enough surrounding context to compare similar surfaces and check whether the feature persists across comparable acquisitions.
Direct Spectral Evidence and Indirect Surface Clues
Exposed Hydrocarbons
Imaging spectroscopy offers a more direct route to detecting exposed petroleum. Hydrocarbon-bearing materials can show absorption features around 1.73 and 2.30 micrometers in the shortwave infrared, or SWIR. Suitable hyperspectral sensors measure narrow, adjacent bands that can help distinguish the shapes of these features.
Interpretation still requires care. Dry vegetation and some soil minerals can interfere with relevant spectral regions. A single low-reflectance band is insufficient: the surrounding spectrum, local background materials, and measurement quality must also support the interpretation.
Staining and Vegetation Stress
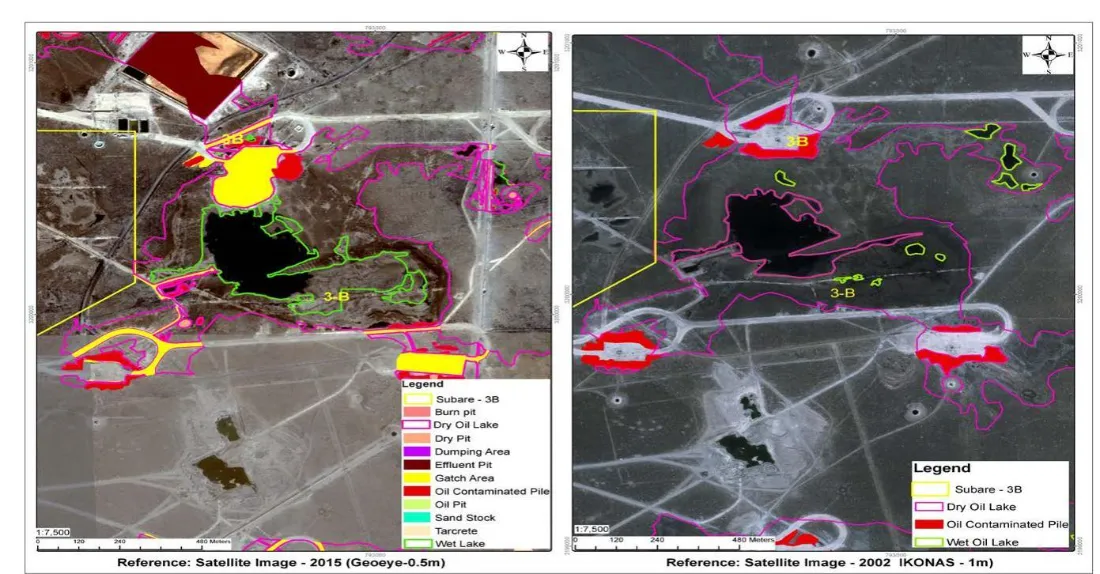
High-resolution optical images may reveal new stains, disturbed ground, or changes around a facility. Multispectral time series may identify unusual vegetation decline. These observations can help locate areas for inspection, but they do not identify the chemical cause.
Drought, salinity, disease, excavation, and seasonal growth changes can resemble contamination-related impacts. An anomaly becomes more useful when it is new, differs from comparable nearby areas, and is consistent with incident records or field observations. Proximity to a pipeline increases its relevance for investigation; it does not prove that the pipeline leaked.
What Research Demonstrates—and What It Does Not
A 2019 study in Remote Sensing of Environment examined three soil types contaminated with 14 levels of crude oil. Researchers used a hyperspectral camera covering 950–2,500 nanometers at distances of 4, 8, and 12 meters. Detection limits varied with soil type and observation conditions.
The study supports an important conclusion: there is no universal soil-oil detection threshold. However, its results describe close-range outdoor measurements. They should not be presented as a demonstrated satellite detection limit.
Airborne research provides another level of evidence. A study of Louisiana salt marshes affected by the Deepwater Horizon spill used AVIRIS imaging spectroscopy and field observations to examine oiling, vegetation stress, and subsequent recovery. That demonstrated capability depended on an airborne instrument and the conditions of the surveyed marshes.
Other research has simulated satellite sensor responses from airborne oil-contamination imagery. Such work can help assess potential sensor suitability, but simulated satellite performance is different from independently validated detection using actual satellite acquisitions.
What Determines Whether a Site Is Detectable?
Soil and Oil Properties
Sandy, clay-rich, carbonate-rich, and organic soils provide different spectral backgrounds. Oil composition, weathering, and its distribution at the visible surface also matter. A model developed on one soil and petroleum product may not transfer reliably to another site.
Surface Exposure
Vegetation, clean sediment, or other cover can conceal contaminated material. Reflected-light imagery observes the exposed surface; it does not measure the full soil profile. No visible anomaly therefore means no anomaly was detected under those observation conditions, rather than proof that the site is uncontaminated.
Spatial and Spectral Resolution
A small contaminated patch may occupy only part of a pixel, mixing its signal with clean soil and vegetation. Finer spatial detail helps locate features, while suitable spectral coverage helps characterize materials. Neither capability substitutes for the other.
For example, EnMAP covers visible, near-infrared, and SWIR wavelengths, including the hydrocarbon absorption regions discussed above, with a nominal 30-meter ground sampling distance. This makes pixel mixing a practical concern for small spills. Conversely, very detailed visible imagery can show a stain without resolving its diagnostic spectrum.
The label “hyperspectral” alone is insufficient when selecting data. A sensor confined to visible and near-infrared wavelengths does not capture the same SWIR evidence. Band coverage, spectral resolution, signal quality, and usable surface-reflectance processing all need checking.
Timing and Observation Quality
Cloud, haze, surface moisture, seasonal vegetation, and the interval between an incident and acquisition can affect interpretation. Cleanup may alter the surface before an image is collected, while vegetation impacts may emerge later. A monitoring plan should specify the required observation window and the consequences of missing it.
A Practical Workflow: Screen, Sample, Confirm
1. Define the Decision
Start with a specific objective: prioritizing inspections around abandoned wells, investigating a reported release, or tracking surface recovery after cleanup. Specify the expected spill size, surface cover, petroleum type, and available incident history before choosing imagery.
2. Screen for Suspected Areas
Compare suitable observations with a pre-incident baseline and similar nearby surfaces. Check image alignment and account for weather, seasonality, terrain, and site activity. Record whether each candidate is supported by spectral evidence, a visible change, vegetation stress, or a radar anomaly.
Deliver a prioritized inspection map with acquisition dates, evidence descriptions, alternative explanations, and areas that could not be assessed. Keep suspected contamination separate from confirmed contamination.
3. Inspect and Collect Samples
Qualified field teams should investigate candidates and design sampling around the suspected source, potential migration routes, background conditions, and relevant depths. Include selected locations without image anomalies to assess missed contamination. Record sample coordinates and depths so laboratory findings can be compared with the surface observations.
4. Confirm and Validate
Laboratory analysis should target the contaminants relevant to the petroleum released. Total petroleum hydrocarbons, or TPH, may be part of the assessment, alongside specific compounds where appropriate. The analytical method and sampling design determine what those results establish.
Validate image interpretation using independent samples, reporting false alarms and missed detections. Any model estimating concentrations needs local calibration and independent testing. A satellite-derived prediction should not be treated as equivalent to a laboratory measurement.
Use Imagery to Make Field Investigation More Focused
Satellite imagery can extend visibility across large oilfields and pipeline corridors, document surface changes, and help teams decide where to investigate first. Its value depends on matching the observation to the target and preserving the distinction between a suspicious feature and confirmed contamination. Greener vegetation after remediation can indicate ecological recovery, but it does not certify that residual soil contamination has been removed.
That assessment should begin before imagery is purchased. STARPATH GLOBAL combines access to satellite resources with data processing and AI analysis to help clients select observations suited to their asset locations, surface conditions, and inspection priorities. Through our imagery catalog, teams can explore data options, then discuss a site-specific monitoring assessment with STARPATH GLOBAL to determine where satellite screening can support field investigation and where additional measurements are needed.