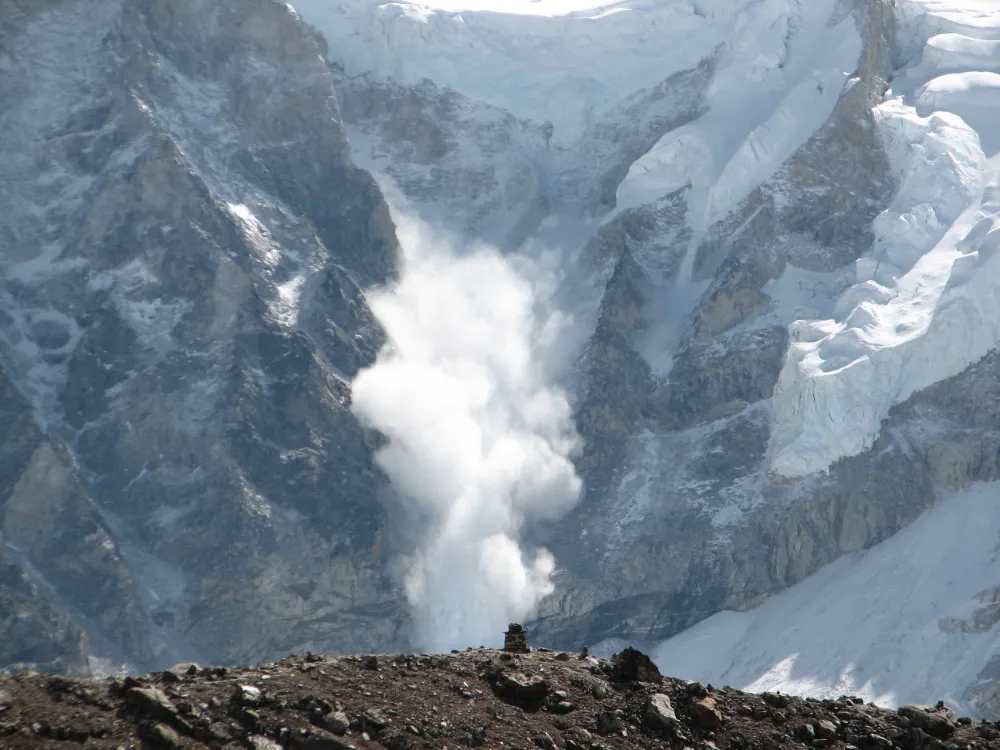
On August 26, 2026, a cascading debris-flow disaster originating on the Nepal side of the China–Nepal border struck Gyirong Port in Xizang, China. Based on pre- and post-event high-resolution satellite imagery, seismic reports, and imagery transmitted from the affected area, an expert working group organized by China’s Ministry of Natural Resources preliminarily assessed that the disaster originated from a high-elevation glacier collapse in Nepal. According to the preliminary assessment, the collapsed ice-and-debris mass moved rapidly downslope, scoured and entrained moraine material along the channel, entered the Donglin Tsangpo river system, and evolved into a debris flow that struck Gyirong Port.Because the investigation is ongoing, the precise failure mechanism and sequence of processes may be refined as additional field and remote-sensing evidence becomes available.
The investigation highlighted the subsequent need for stronger remote sensing monitoring of high-altitude glacier zones, glacial lakes, and potentially unstable high-elevation bodies; systematic identification of hazard sources that could threaten downstream infrastructure and populated areas; analysis of potential movement paths based on terrain, channels, and river networks; and closer coordination among satellite remote sensing, UAV inspections, ground-based monitoring, and meteorological early warning systems.
These recommendations point to a question that goes beyond identifying a hazard source after an event has occurred. In high-mountain valleys, many potential hazard sources lie in remote, difficult-to-access terrain. The broader challenge is not only to explain a disaster after it occurs, but to identify potential hazard sources, track how they change, and assess how a failure could affect downstream areas.
Identifying Potential Hazard Sources Across Large Mountain Areas
High-mountain hazard sources are not limited to glaciers.
Hanging glaciers on steep slopes can experience ice failures and avalanches. Expanding glacial lakes may increase downstream exposure, while moraine-dam degradation, overtopping, internal erosion, or impact waves generated by ice and rock avalanches can contribute to a glacial lake outburst flood. Unstable rock or soil masses at high elevations may fail into channels, transform into debris flows or debris-laden floods, or temporarily block rivers and create landslide dams.
With such a wide range of potential hazards, monitoring cannot simply mean looking at every location in the same way. The first step is to build a broader picture of where potential hazard sources are located: Which ice bodies, glacial lakes, or slopes could become unstable? What are their size, terrain setting, and potential downstream exposure?
Basin-scale inventories are increasingly being used to screen large Himalayan catchments for potential glacier-related hazards. A 2026 study in the Alaknanda Basin of the central Himalaya developed a basin-scale inventory of hanging glaciers using glacier morphology and terrain characteristics, and conducted preliminary avalanche-flow modeling and exposure assessment for a selected sample area. The study mapped 219 hanging glaciers across the basin, covering 71.7 ± 3.5 km²; meanwhile, the authors noted that exposure and hazard potential varied substantially among them.

Map showing the locations of mapped hanging glaciers across the sub-basins. The lower-left inset bar graph compares the total number of each hanging glacier type within individual sub-basins. Glacier types are colour-coded, with ramp-slab glaciers shown in red, terrace-slab glaciers in blue, and terrace-wedge glaciers in green. Source: Krishnan et al., npj Natural Hazards (2026)
The value of this type of work goes beyond producing an inventory. It helps narrow a vast mountainous region down to a smaller number of locations that warrant closer attention. For large and difficult-to-access mountain environments, this points to a practical monitoring workflow: use broad-area screening to identify priority hazard sources, then concentrate more detailed monitoring where terrain, exposure, or observed changes indicate greater concern.
This also means that satellite data should be matched to the monitoring task. Data used for broad-area screening may have very different requirements from imagery used for detailed analysis and deformation monitoring in priority areas. Rather than automatically choosing the highest available specifications, it is more important to select data based on the monitoring area, target scale, and analytical objective. Compare Optical and SAR Imagery for Remote-Area Monitoring →
What Matters Is Not Only Where a Hazard Source Is, but How It Changes
Once priority areas have been identified, the next question is their current state.
Ice bodies and high-elevation slopes are not static. Changes in displacement, crack development, movement velocity, and glacial lake extent can all reflect changes in their condition. Compared with a single image, a time series provides a much richer context because it allows changes to be viewed over time rather than as isolated observations.
On February 7, 2021, a massive rock-and-ice avalanche detached from the north face of Ronti Peak in Chamoli District, Uttarakhand, India, and developed into a long-runout debris flow and flood. A subsequent retrospective analysis of multi-temporal satellite observations found evidence of progressive fracture development and deformation in the source area before the collapse.

Time series of the headwall crack opening in high-resolution optical images from SPOT 7 and Pléiades-HR. Source: Van Wyk de Vries et al., Natural Hazards and Earth System Sciences (2022)
In that retrospective study, the mapped fracture propagated at approximately 0.07 m/day until September 2020 and subsequently accelerated to an average of about 0.14 m/day. The same study reported a maximum local deformation velocity of approximately 0.5 m/day in the source area during the days preceding failure.
The importance of this case is not that deformation monitoring can “predict an ice avalanche.” Rather, the retrospective evidence shows that some slope failures may be preceded by a longer period of detectable change, although the presence, duration, and observability of such precursors vary from site to site.
Long-term observations can reveal how deformation and other surface changes evolve over time, providing evidence for investigating whether observed behavior departs from a site-specific baseline and may warrant further stability assessment.
At the same time, not every hazard will show the same precursors. Different glaciers, ice masses, and slopes behave differently, and some may not exhibit clear short-term warning signals. The focus, therefore, should not be a single measurement or threshold, but whether changes persist, accelerate, or occur alongside other environmental changes.
This raises a more practical question: how can these changes be measured repeatedly and quantitatively over time?
InSAR: Turning Subtle Changes into Trackable Displacement
When the focus shifts from detecting visible change to estimating displacement and its evolution over time, repeat-pass SAR can provide an important data foundation.
Synthetic Aperture Radar (SAR) is an active remote sensing technology that transmits microwave signals and records their return from the surface. Because SAR does not depend on sunlight and microwave signals are generally less affected by cloud cover than optical wavelengths, it can support day-and-night observations when optical imagery is limited. However, steep terrain can produce radar shadow and layover, while snow, melt, surface change, and heavy precipitation may affect image interpretation or interferometric coherence.
Interferometric Synthetic Aperture Radar (InSAR) estimates relative surface displacement along the satellite’s line of sight by comparing phase information from two or more SAR acquisitions, provided that sufficient interferometric coherence is preserved.
When the same ground target moves slightly between two observations, the distance between that target and the satellite changes. This change is reflected in the phase of the returned radar signal. After accounting for orbital geometry and topography, part of the remaining phase difference can be interpreted as displacement along the radar line of sight. The estimate may still be affected by atmospheric delay, DEM error, phase-unwrapping uncertainty, geometric distortion, and temporal decorrelation.
Compared with a single image, multi-temporal InSAR can answer more specific questions:
How much has the surface moved?
How long has the change persisted?
Has the rate of movement changed?
When multiple observations are connected over time, they can form a deformation time series for a potential hazard source, making it possible to track displacement magnitude, velocity, and trends.
However, for glaciers and high-mountain slopes with complex movement directions, the displacement observed along the radar line of sight does not necessarily represent the full three-dimensional motion.
A 2026 study in the Badrinath region of the central Himalaya used Sentinel-1A and Sentinel-1C data to combine line-of-sight and azimuth displacement measurements and reconstruct multidimensional glacier velocity. The authors reported that LOS-only measurements underestimated reconstructed glacier motion by approximately 60–70% in several trunk and tributary glaciers, demonstrating that viewing geometry and motion direction must be considered when interpreting glacier velocity.

In other words, deformation monitoring is not just about detecting change. It is also about describing the direction, magnitude, and duration of that change as accurately as possible.
Deformation Is Not the Answer: Understanding What the Change Means
Displacement should not be interpreted as evidence of imminent failure—or as a complete measure of hazard—without additional context. Glaciers and slopes may move seasonally or gradually, and similar displacement rates can have different meanings under different geological, topographic, thermal, and hydrological conditions.
Interpretation therefore requires multiple sources: optical imagery for visible fractures and lake boundaries, SAR for displacement, DEMs for terrain, and meteorological, hydrological, UAV, or ground observations for environmental and field context. Together, these data can help determine whether a signal departs from the site’s established baseline or persists across independent observations.
Satellite remote sensing can provide traceable evidence of surface change, but it cannot by itself determine whether, when, or how a failure will occur.
For high-mountain monitoring, the challenge is not simply acquiring imagery, but integrating observations around a clearly defined decision: which sources require closer investigation, which changes should trigger additional monitoring, and which downstream people or assets may be exposed. See How Multi-Source Earth Observation Supports Environmental and Hazard Monitoring →
From Where Change Is Happening to Where a Hazard Could Go
Hazard assessment cannot stop at the source area. An ice avalanche, landslide, or glacial lake failure may entrain additional material, enter a river, block a channel, or travel far downstream. Analysis must therefore consider possible runout paths, blockage locations, and the communities, roads, bridges, ports, and other assets that could be exposed or affected.
A 2026 study of Qiangzongke Co near the China–Nepal border combined optical imagery, Sentinel-1 InSAR, UAV and field data, and hydrodynamic models to examine a potential landslide-triggered glacial lake outburst flood. Rather than treating lake expansion or adjacent slope displacement as a standalone warning, the study modeled how a possible slope failure could enter the lake, generate a surge, affect the moraine dam, and propagate downstream.

At this stage, remote sensing is no longer used simply to locate areas of change. It becomes part of a broader analytical chain connecting the source of a potential hazard with its possible downstream impacts:
Hazard-source inventory → change monitoring → susceptibility and stability assessment → process-chain and runout modeling → exposure and vulnerability analysis → risk-informed decision support
From Seeing Change to Understanding Risk
High-mountain environments are complex. Potential hazard sources vary widely, and their failure mechanisms can differ substantially from one location to another. Effective monitoring therefore cannot depend on a single satellite, a single indicator, or a single threshold.
A more practical approach is to use broad-area remote sensing and terrain information to identify priority areas, then use multi-temporal SAR and optical imagery to track changes over time. When a signal departs from the site-specific baseline, persists across multiple acquisitions, accelerates, or is confirmed by an independent data source, DEMs, meteorological and hydrological observations, UAV surveys, and ground-based instruments can be used to investigate the signal and assess whether monitoring should be intensified.
For a real-world high-mountain hazard monitoring project, the difficult part is often not obtaining a satellite image. It is connecting the different stages of the process: deciding what areas need attention, selecting the right data, interpreting changes, combining different sources, and ultimately turning the results into information that supports risk assessment.
For example, broad-area screening may rely on imagery with wider coverage, while priority locations may require different data better suited to deformation, crack, or terrain analysis. As the project progresses, the data mix and analytical approach may also need to evolve with the monitoring results.
For teams exploring this type of application, the first question is therefore not “Which satellite should we buy?” but “What decision do we need to make, and what evidence would make it more reliable?” STARPATH GLOBAL’s Forward Deployed Engineers work with clients to define the monitoring target, evaluate suitable data, establish validation criteria, and design a pilot workflow before wider deployment.
Assess Whether Satellite Monitoring Is Feasible for Your Area of Interest
Define the hazard source, observation area, decision requirement, monitoring indicators, suitable data, and validation approach before committing to a full deployment.